
CME Daily Volume and Open Interest: How to Read the Daily Report
The weekly COT report tells you where the big money stands. The CME daily volume and open interest report tells you what it did yesterday. Here is what the numbers mean and how ICC Terminal turns them into a daily signal.
What the daily report is
Every trading day CME Group publishes, for each futures market, the settlement price, the volume (how many contracts traded) and the open interest (how many contracts are still open at the close). Because every futures contract has a buyer and a seller, open interest goes up only when new positions are opened and down only when positions are closed.
That is what makes it so useful: price tells you where the market went, the change in open interest tells you whether new money pushed it there or old positions were being closed.
| Field | What it tells you |
|---|---|
| Settle | The official closing price of the contract for the session. |
| Change | Settlement versus the previous session. |
| Volume | Contracts traded — activity, including day trades. |
| Open interest (at close) | Contracts still open after the session. |
| OI change | New positions opened (up) or closed (down). |
Volume or open interest?
Volume is a measure of activity: a day trader who buys and sells the same contract within the hour adds to volume twice but leaves open interest unchanged. Open interest only moves when positions are carried overnight, which is what large funds and hedgers do. That is why a big volume day with flat open interest is mostly churn, while a modest volume day with a large rise in open interest shows real new commitment. Read volume as the loudness of the session and open interest as its conviction.
Preliminary vs final
CME publishes the numbers twice. A preliminary report comes out the same evening — for most markets by about 01:00 UTC — and the final report follows the next day, around 17:00 UTC, after late trades and corrections are processed. The two are usually close, but the final one can differ.
ICC Terminal checks every hour while the preliminary report is due and again for the final one. Each session is labelled Prelim or Final, and when a preliminary session turns final it is downloaded again, so the stored history is always the final version. The terminal also notes when each report arrived, so you know how fresh the data is.
Front month vs all contracts
A futures market has several contract months trading at the same time. ICC Terminal uses:
- the front month — the contract with the biggest open interest — for the settlement price and price change, because that is where most of the trading happens;
- the totals of all contract months for volume and open interest, which is how CME's own volume and open interest page reports them. Totals keep a monthly roll from looking like a mass exit.
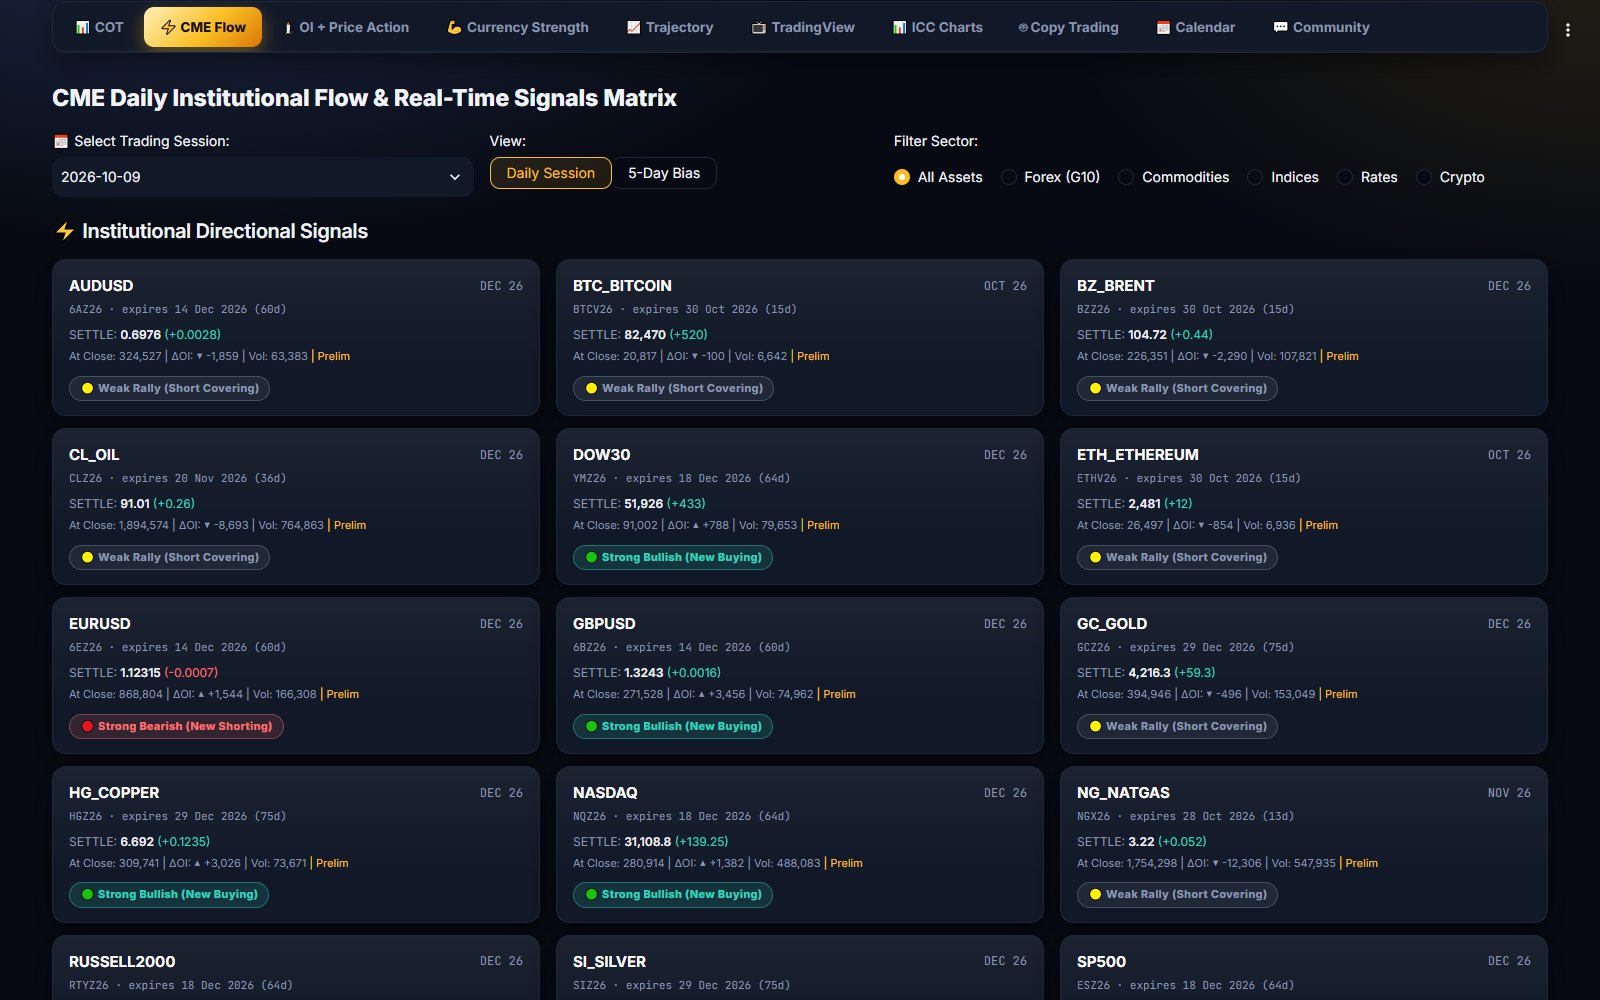
From numbers to a signal
Each session is classified by price and open interest together — the classic quadrant explained in open interest + price action:
- Price up, open interest up — Strong Bullish (New Buying).
- Price up, open interest down — Weak Rally (Short Covering).
- Price down, open interest up — Strong Bearish (New Shorting).
- Price down, open interest down — Weak Drop (Long Liquidation).
The 5-day bias
One session can be noise. The 5-day bias adds up the last five sessions: new buying scores +1, short covering +½, long liquidation −½ and new shorting −1. The average is mapped to a flow index from 0% to 100%:
| Flow index | Bias |
|---|---|
| 75% or more | STRONG BUY |
| 60–75% | BUY |
| 40–60% | NEUTRAL |
| 25–40% | SELL |
| 25% or less | STRONG SELL |
100% means every one of the five sessions was new buying; 0% means every session was new shorting. You can switch between Daily Session and 5-Day Bias in the CME Flow tab.
Expiries and rollovers
Open interest naturally falls as a contract approaches its last trading day or, for physically delivered markets such as gold and crude oil, its first notice day. ICC Terminal keeps a contract calendar from CME for every market — the next contracts, their codes, last trade and first notice dates — and shows it next to each market's chart, so you can tell a roll from real liquidation.
Putting it to work
- Start with the weekly picture from the COT report.
- Check the daily signal and the 5-day bias: is fresh money confirming the weekly direction?
- Look at the OI + Price Action chart to see which candles were driven by new positions.
- Plan entries with your own levels and risk, and be careful in the days around expiry.
CME flow for 42 markets, every session
ICC Terminal downloads CME's volume and open interest for forex, metals, energy, grains, indices, rates and crypto, labels prelim and final sessions and builds the 5-day bias automatically.
FAQ
When is the CME daily open interest published?
CME releases a preliminary report in the evening after the session, usually by about 01:00 UTC, and the final report the next day, around 17:00 UTC.
Why does open interest fall before expiry even when the trend is strong?
Traders close the expiring contract and open the next one. Looking at all contracts together, as ICC Terminal does, keeps most of that roll from looking like traders leaving the market.
Is volume or open interest more important?
Open interest. Volume counts every trade, including positions opened and closed the same day. Open interest only changes when positions are really added or closed, so its change shows commitment.