
How to Read the COT Report (Commitments of Traders)
Every Friday the US regulator publishes who holds what in the futures markets: banks, hedge funds and the companies that use these markets to hedge. Here is what every number means and how traders actually use it.
What the COT report is
The Commitments of Traders (COT) report is published by the US Commodity Futures Trading Commission (CFTC). It counts every open futures position held by large traders in markets such as gold, crude oil, the S&P 500, Treasury bonds and the major currencies — and says which type of trader holds it.
The data is collected on Tuesday and released on Friday at 3:30 PM New York time. So when you read it, it is three days old. That is fine: the COT report is not a day-trading signal, it is a map of where the big money is positioned for the coming weeks.
The three groups of traders
| Group | Who they are | Why they trade |
|---|---|---|
| Non-commercials (large speculators) | Hedge funds, CTAs, money managers | To make a profit from price moves. Often called smart money. |
| Commercials (hedgers) | Producers and users: miners, oil companies, airlines, exporters, banks | To protect their business from price changes, not to speculate. |
| Non-reportables (small traders) | Everyone below the reporting size | Mostly retail; usually the least informed group. |
Commercials are usually on the opposite side of speculators. When funds are buying gold, miners are selling forward production into that strength. That is why most traders follow the non-commercial net position.
Reading the columns
- Long and Short — the number of contracts the group holds betting on a rise and on a fall.
- Net position = Long − Short. Positive = net long, negative = net short.
- Change — how much the position moved since last week. A big jump shows fresh conviction.
- Open interest — all open contracts. Rising open interest with a rising net long means new money is joining the trend.
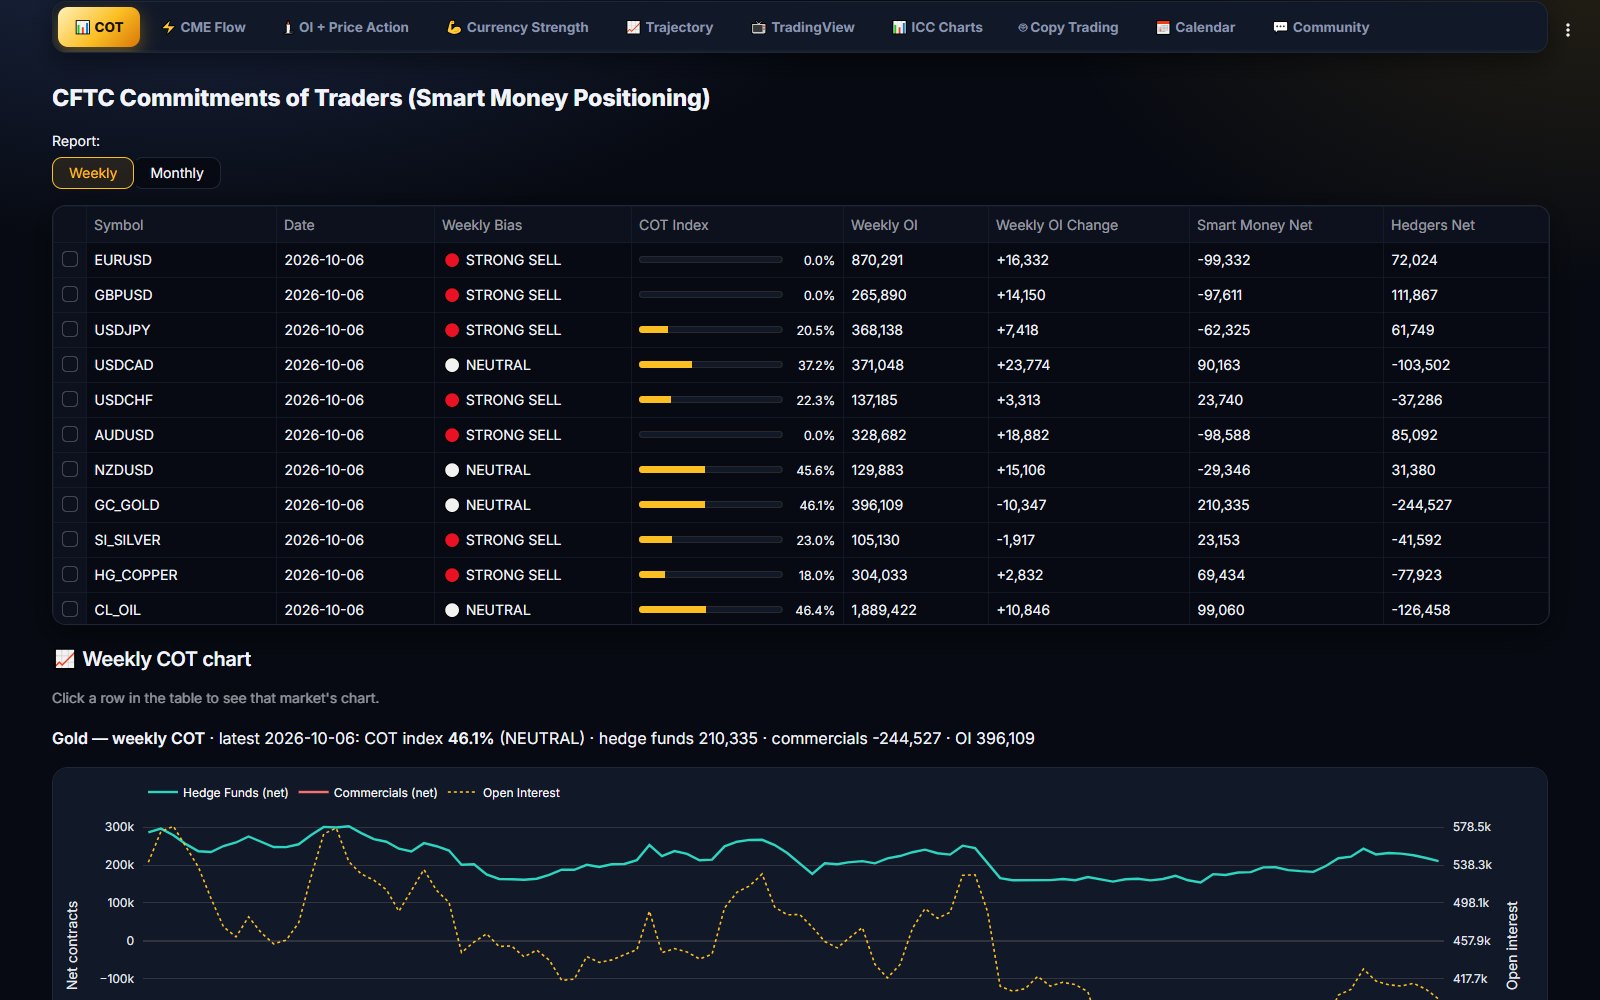
The COT index (0–100%)
A net long of 150,000 gold contracts tells you little on its own. Is that a lot? The COT index answers it: it places the current net position inside its range of the last weeks or months.
- 100% — speculators are as long as they have been in the whole period.
- 0% — they are as short as they have been.
- Above 70% — strong bullish positioning. Below 30% — strong bearish positioning.
ICC Terminal uses a 13-week window for the weekly view and a 12-month window for the monthly COT, so you see both the short swing and the bigger picture.
How traders use it
- Trend filter. Trade in the direction of the speculators' net position and its weekly change. If funds keep adding longs in EURUSD week after week, look for buys, not sells.
- Extremes. When the COT index sits near 100% or 0% for weeks, the trade is crowded. New buyers (or sellers) are running out, and a reversal becomes more likely when price confirms it.
- Divergence. Price makes a new high but speculators reduce their net long — the move is losing its fuel.
- Timing with daily data. Combine the weekly COT direction with the daily open interest and price reading, so you enter when fresh money confirms the weekly picture.
Common mistakes
- Using it for exact entries. The data is weekly and three days old.
- Reading the raw number. Compare it with its own history (the COT index) instead.
- Forgetting inverted pairs. A long yen future is a short USDJPY.
- Following commercials as if they were speculators. Hedgers sell into rallies by design.
See the COT report for 42 markets in seconds
ICC Terminal downloads the CFTC report every week and shows the COT index, net positions and a clear weekly bias for forex, gold, oil, indices, rates and crypto — on Android, Windows and the web.
FAQ
When is the COT report released?
Every Friday at 3:30 PM US Eastern time (19:30–20:30 UTC), with positions as of the same week's Tuesday. On US holidays it can move to Monday.
Who are the non-commercials?
Large speculators such as hedge funds and CTAs that trade futures for profit. Many traders call them smart money.
Is the COT report a timing signal?
No. It works best for the bigger trend and for spotting extremes. Use price action or daily flow for timing.