
Open Interest and Price Action: Who Is Behind the Move?
A rising price can mean fresh buyers are piling in — or that sellers are simply closing their bets. Open interest tells the two apart. Learn the four combinations and you will read every futures session differently.
What open interest is
Open interest (OI) is the number of futures contracts that are still open at the end of a session. Every contract has a buyer and a seller, so one contract of open interest means one long and one short position.
- When a new buyer and a new seller open a trade, open interest rises by one.
- When an existing long sells to an existing short who is closing, open interest falls by one.
- When an existing position simply changes hands, open interest stays the same.
Volume counts every trade; open interest counts the positions left open. That is why OI shows whether money is entering or leaving a market. CME Group publishes the final volume and open interest for every futures market every day.
The four combinations
| Price | Open interest | Name | What it means |
|---|---|---|---|
| ⬆️ up | ⬆️ up | New buying (strong bullish) | Fresh longs are entering. Buyers are adding money — the strongest kind of rally. |
| ⬆️ up | ⬇️ down | Short covering (weak rally) | Shorts are buying back to close. The rise can be fast but lacks new buyers. |
| ⬇️ down | ⬆️ up | New shorting (strong bearish) | Fresh shorts are entering. Sellers are adding money — the strongest kind of decline. |
| ⬇️ down | ⬇️ down | Long liquidation (weak drop) | Longs are selling to close. Prices fall because buyers are leaving, not because sellers are pressing. |
If price or OI does not change, the session is neutral. These four labels are exactly the signals you see in the CME Flow and OI + Price Action tabs of ICC Terminal.
Why the difference matters
Imagine gold rises $25 in a day. If open interest jumps at the same time, new buyers committed money — the move has fuel, and pullbacks are often bought. If open interest fell, the rally came from shorts running for cover. Once the covering is done, the market can stall because nobody new is buying.
The same logic works on the way down. A drop with rising OI shows conviction from sellers. A drop with falling OI is often profit-taking by longs, which can end quickly.
How ICC Terminal scores the flow
ICC Terminal reads CME's daily settlement and the total futures volume and open interest for 42 markets. Two views build on the same four combinations:
- 5-day bias (CME Flow tab). Each of the last five sessions is scored: new buying +1, short covering +½, long liquidation −½, new shorting −1. The average is turned into a flow index from 0% to 100%: 75% or more = STRONG BUY, 60–75% = BUY, 40–60% = NEUTRAL, 25–40% = SELL, 25% or less = STRONG SELL.
- OI + Price Action tab. Daily candles carry the label of every session. The daily bias adds the last 5 sessions (strong combinations count ±2, weak ones ±1); the weekly bias does the same with the last 4 weekly reports, using the open interest from the CFTC report.
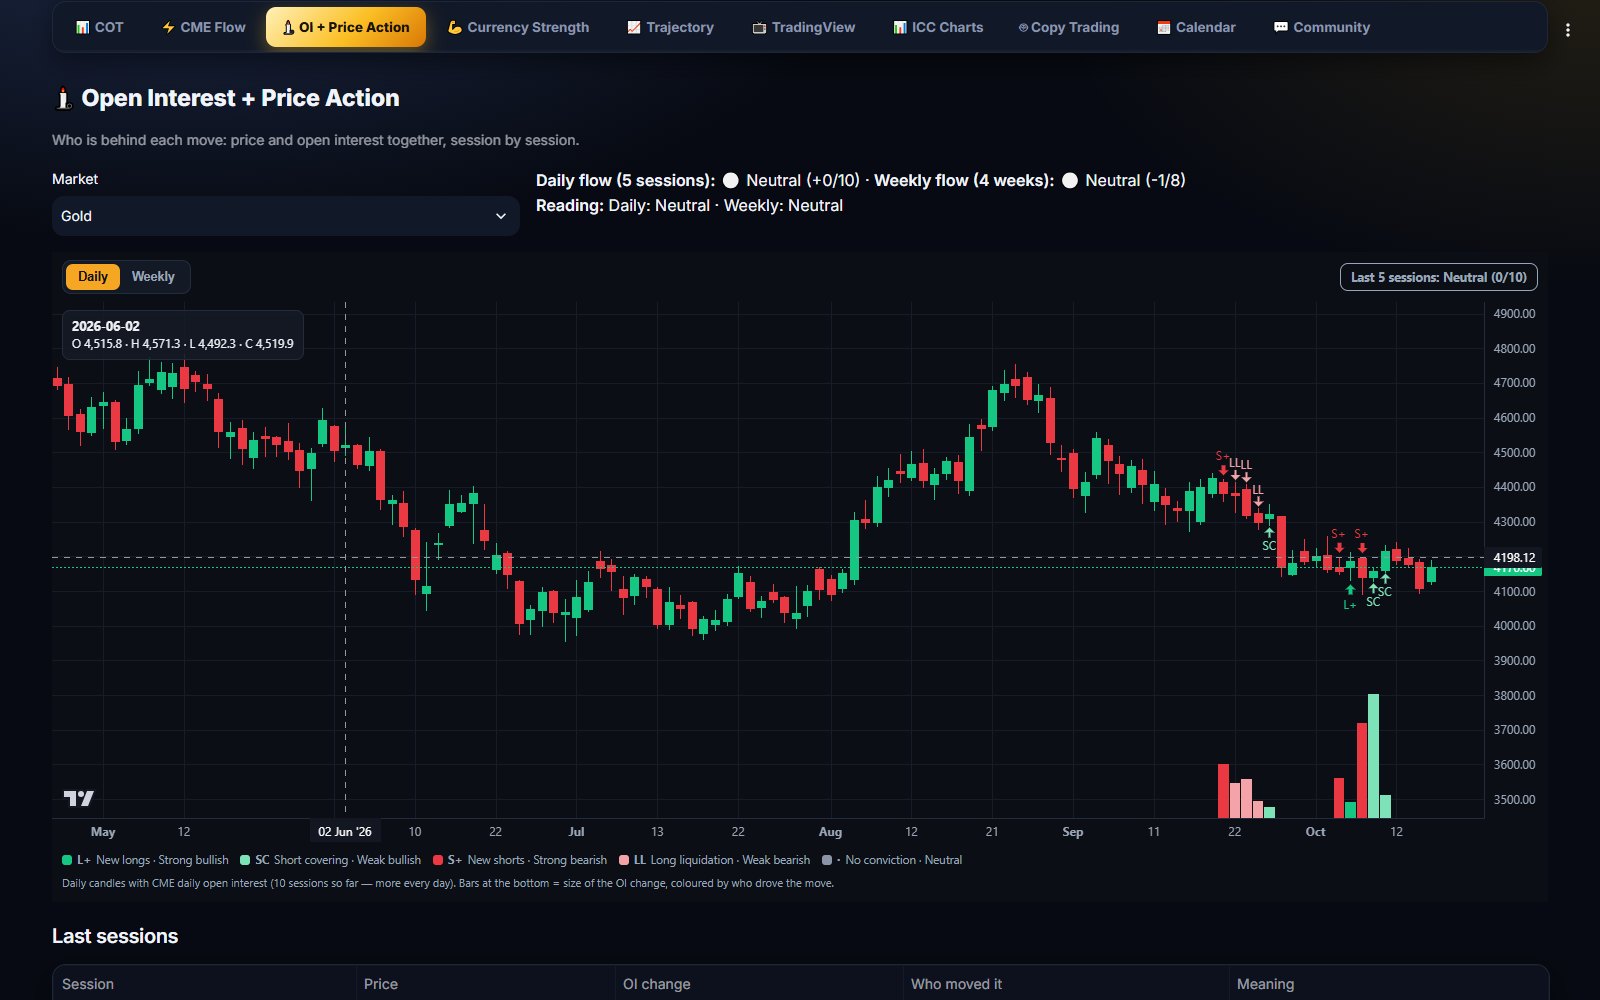
For pairs where CME trades the other currency (yen, Canadian dollar, Swiss franc, peso, rand, real), ICC turns the price direction around, so the signal is read for USDJPY, USDCAD and the others as you trade them.
Three practical examples
1. Breakout with fuel
EURUSD breaks above a range and the CME session shows new buying, with the 5-day flow climbing above 60%. The breakout is backed by new positions — a better setup than a breakout on falling open interest.
2. Rally to sell into
Crude oil bounces for three days, but every session is short covering. The rise has no new buyers; if the weekly COT picture is bearish, some traders wait for the covering to finish and look for shorts at resistance.
3. Exhausted sell-off
An index falls hard for a week, then the sessions switch from new shorting to long liquidation and finally to short covering. Selling pressure is fading, which often precedes a bounce.
Limits to keep in mind
- The daily data is end-of-day: it describes the session after it closed.
- Around contract expiry, open interest moves as traders roll into the next month. Judge those days with care.
- Use the flow together with the weekly COT report and your own chart levels.
A simple daily routine
- After the CME final report (ICC refreshes the data several times a day, with the final report around 17:00 UTC), open the CME Flow tab and pick the session.
- Scan for markets with new buying or new shorting — these are the sessions where money committed.
- Switch to the 5-day bias view: is the flow index above 60% or below 40%? One strong session matters less than a run of them.
- Check the weekly COT index of the same market. Agreement between weekly positioning and daily flow is the setup many traders wait for.
- Open the OI + Price Action chart to see where on the chart the flow happened — at support, resistance or in the middle of a range.
The whole check takes a few minutes and keeps you from chasing moves that have no new money behind them.
See the flow behind every session
ICC Terminal turns CME's daily volume and open interest into signals and a 5-day bias for 42 markets. The user guide explains every chart.
FAQ
Is rising open interest always bullish?
No. Rising open interest means new positions are opening. It is bullish when price rises at the same time (new buying) and bearish when price falls (new shorting).
Where does the daily open interest come from?
From CME Group's daily volume and open interest report. ICC Terminal downloads it several times a day and keeps the history for every market.
What is the difference between volume and open interest?
Volume counts every contract traded in a session. Open interest counts the contracts still open at the end, so it shows whether money entered or left the market.