
What is ICC Terminal?
ICC Terminal shows you where the big money is positioned in 42 futures markets — 7 major currency pairs plus EURGBP, EURJPY, USDMXN, USDZAR and USDBRL; gold, silver, platinum, palladium and copper; WTI and Brent oil, natural gas, gasoline and heating oil; corn, soybeans, wheat, live cattle and lean hogs; S&P 500, Nasdaq, Dow 30, Russell 2000, MidCap 400 and Nikkei 225; US 2-, 5-, 10- and 30-year Treasuries and Fed Funds; Bitcoin, Ethereum, Solana and XRP.
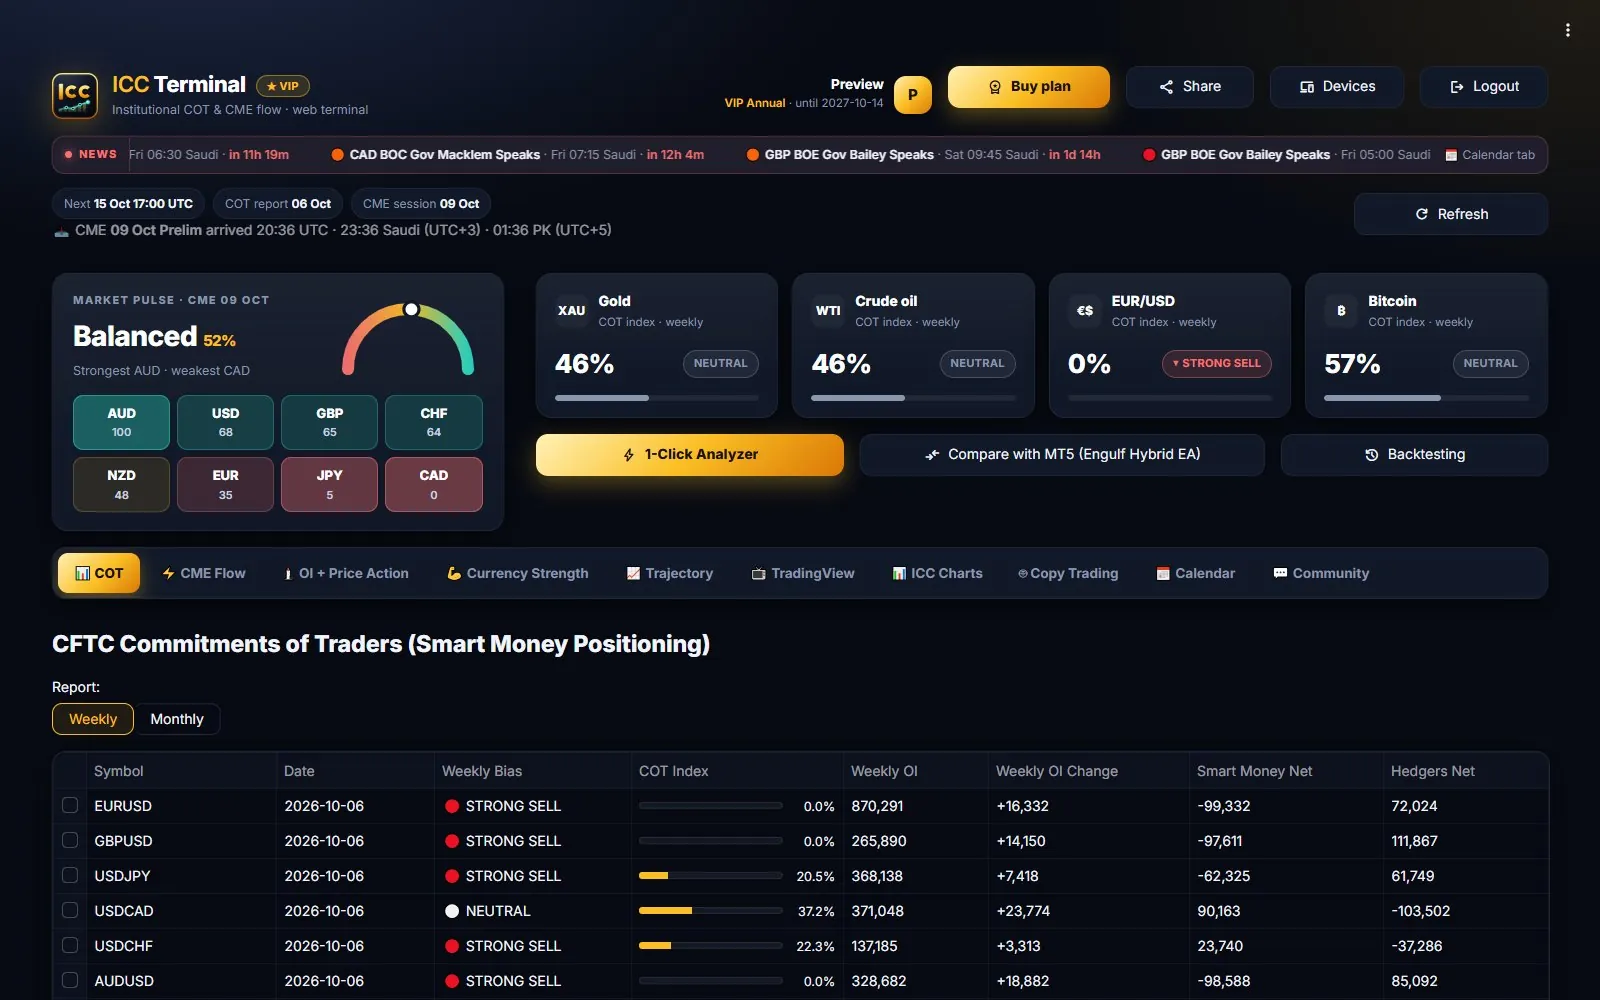
- CFTC Commitments of Traders (COT) — the official weekly report of how large speculators (hedge funds) and commercial hedgers are positioned.
- CME Group daily data — settlement price, volume and open interest of every session, so you see the institutional flow day by day.
- Both are turned into clear signals: bias, COT Index, 5-day bias, OI + Price Action and currency strength.
Free and VIP
- Free / guest: the weekly COT table with the COT Index and the currency strength.
- VIP: COT details and charts, the monthly report, CME daily signals, 5-day bias, OI + Price Action, Dual-Axis charts and MT5 copy trading.
Install the app
ICC Terminal works on Android, Windows and in any web browser. Use the same account everywhere.
Android
- Open iccterminal.trade on your phone and tap Download APK.
- Open the downloaded file. The first time, Android asks to allow Install unknown apps for your browser — allow it and go back.
- Tap Install, then Open. Log in or continue as a guest.
Windows
Download ICC Terminal for Windows and run it. It installs itself with Desktop and Start Menu shortcuts. If Windows SmartScreen appears, click More info → Run anyway.
Web terminal
Nothing to install: open app.iccterminal.trade in Chrome, Edge or Safari and log in.
Your account
Tap the account icon at the top of the app (in the web and Windows terminal: Log in / Create account) to create a free account with your email.
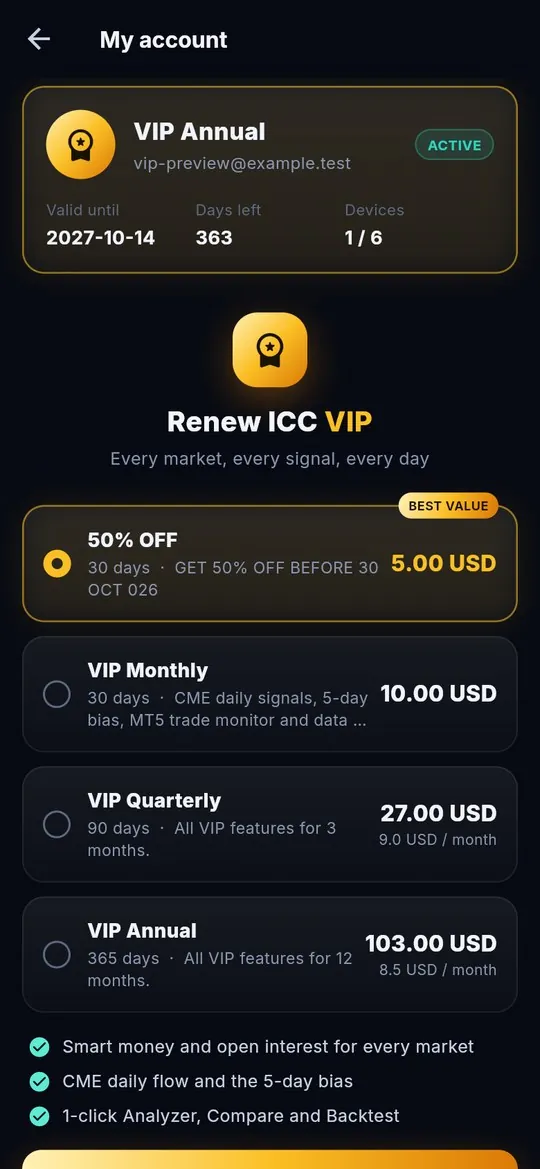
- Remember me keeps you logged in; on phones you can also switch on Log in with fingerprint in Settings.
- One account works on the Android app, the Windows app and the web terminal. Your plan decides how many devices can be used at the same time.
- My Account shows your plan, the expiry date, Change password, Need help? Contact support and the plans you can buy.
How to read the weekly COT report
Open the tab COT (in the app: Markets → COT) and keep Weekly selected. Every row is one market.
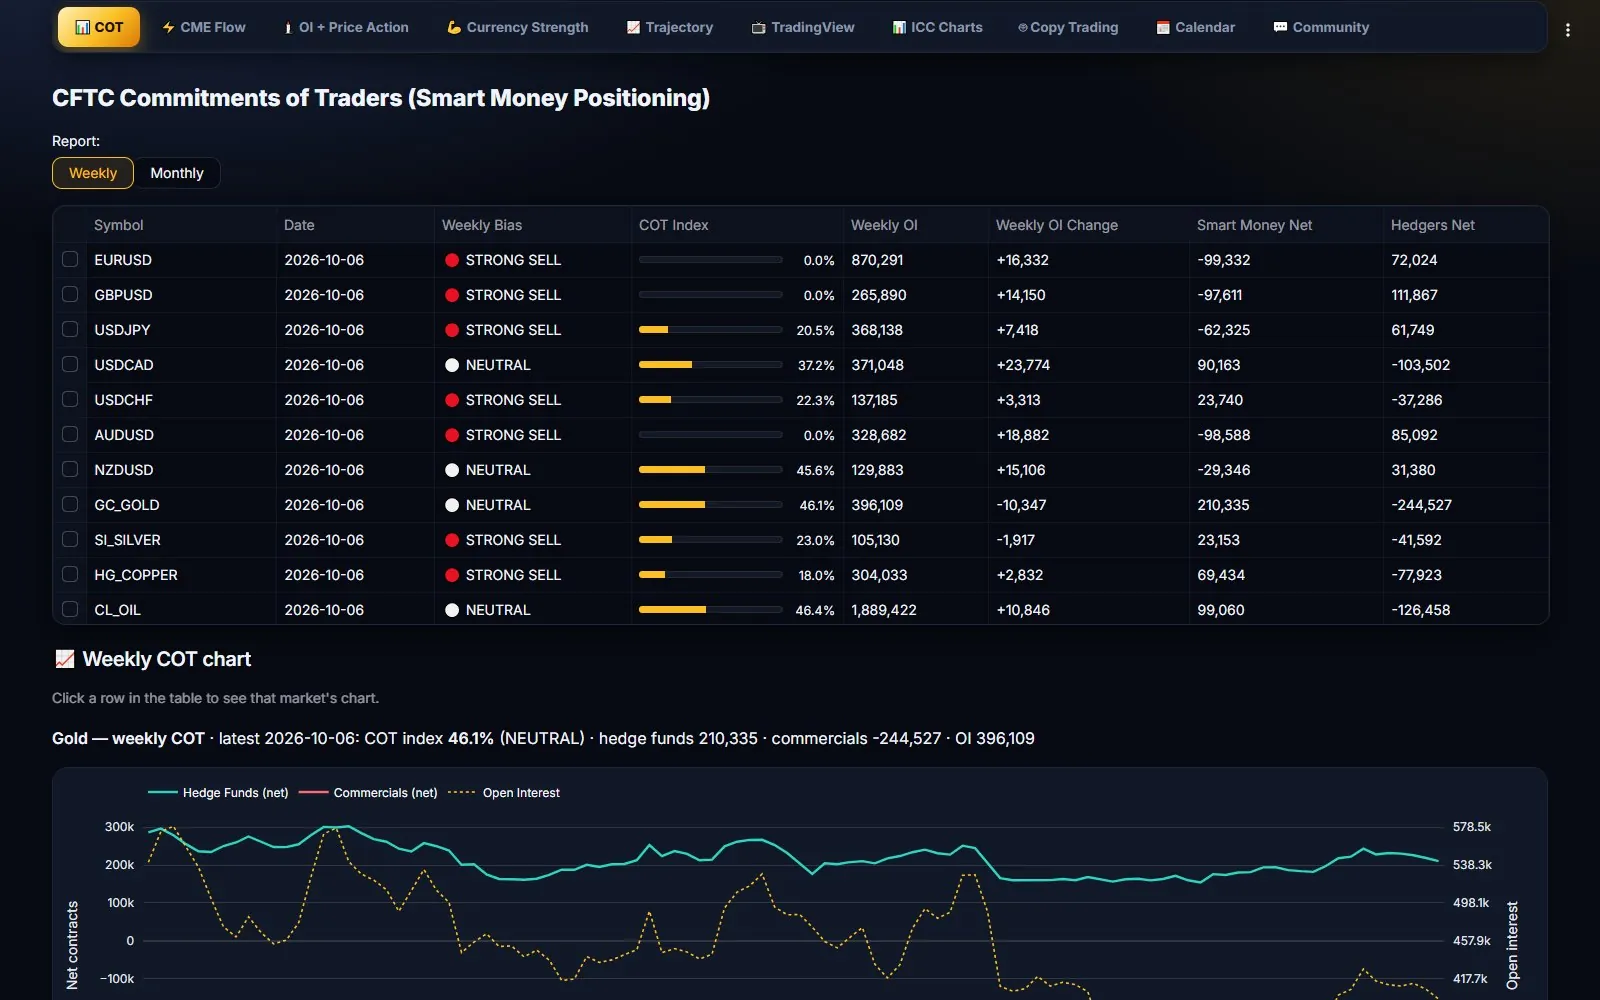
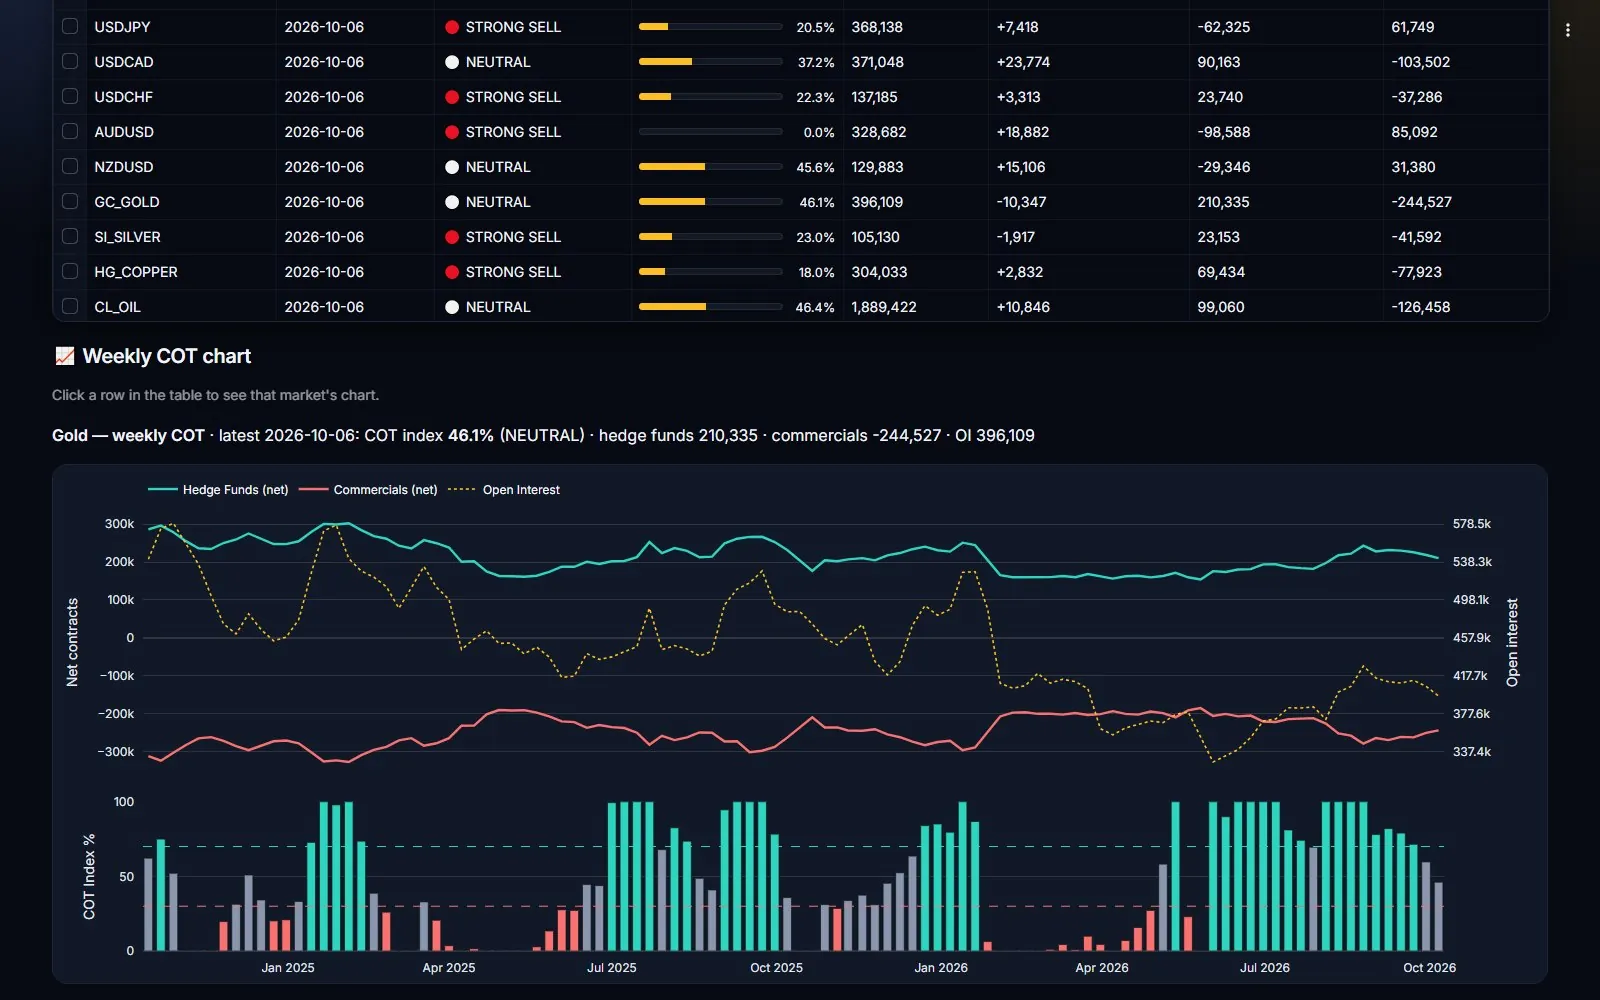
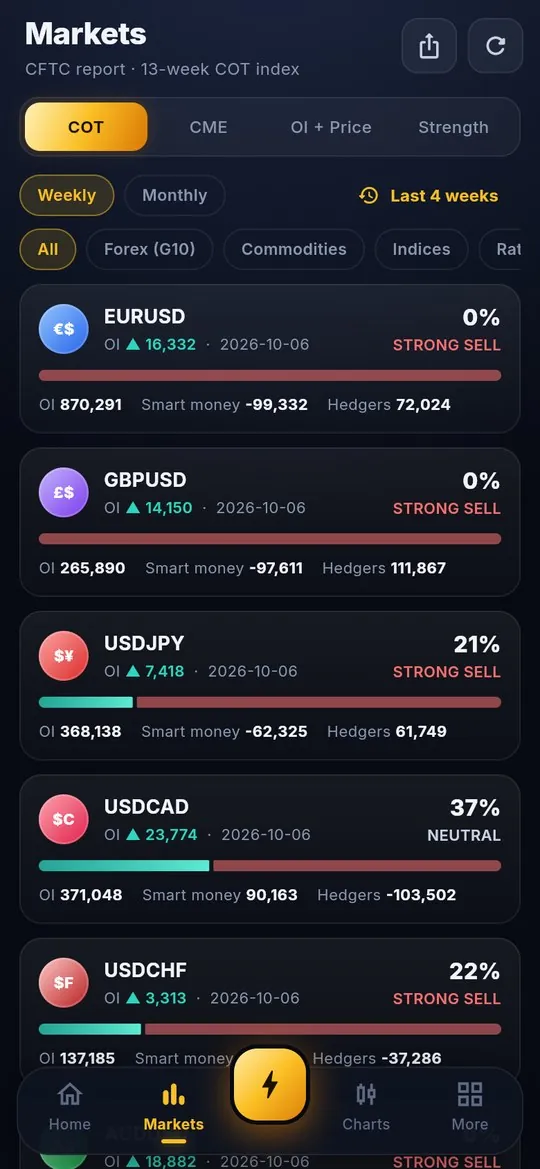
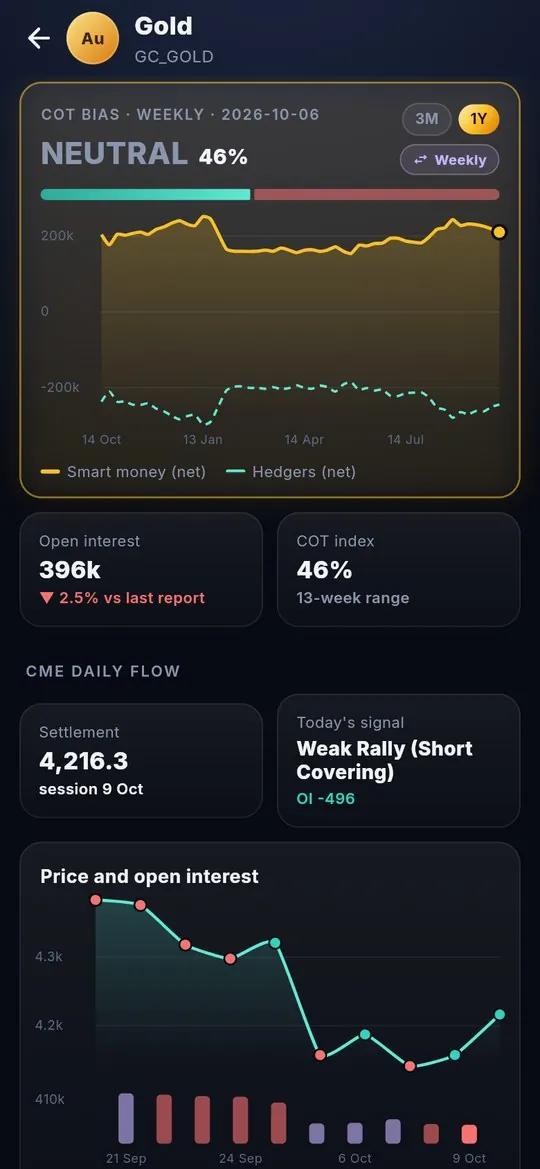
| Column | What it means |
|---|---|
| Symbol / Date | The market and the date of the CFTC report (positions as of Tuesday). |
| Weekly Bias | STRONG BUY when the COT Index is 70% or higher, STRONG SELL at 30% or lower, otherwise NEUTRAL. |
| COT Index | Where the smart-money net position stands inside its range of the last 13 weeks (about 3 months). 100% = most bullish of that period, 0% = most bearish. |
| Weekly OI | Open interest: the total number of open futures contracts. |
| Weekly OI Change | Change of open interest against the previous week. Rising OI = new money entering the market. |
| Smart Money Net | Large speculators (hedge funds): long contracts minus short contracts. |
| Hedgers Net | Commercials (producers and big companies that hedge): usually the opposite of smart money. |
Reading it step by step
- Look at the Weekly Bias first to find markets with a clear direction.
- Check the COT Index: above 70% the funds are building longs, below 30% they are building shorts. Very close to 100% or 0% can also mean the move is crowded.
- Confirm with Weekly OI Change: bias plus rising open interest = strong conviction; falling OI = positions are being closed.
- Click a row to open the Weekly COT chart of that market and see whether smart money is still adding or starting to turn.
The monthly COT report
Tap Monthly above the COT table. Each month uses its last weekly report, which removes weekly noise and shows the longer trend.
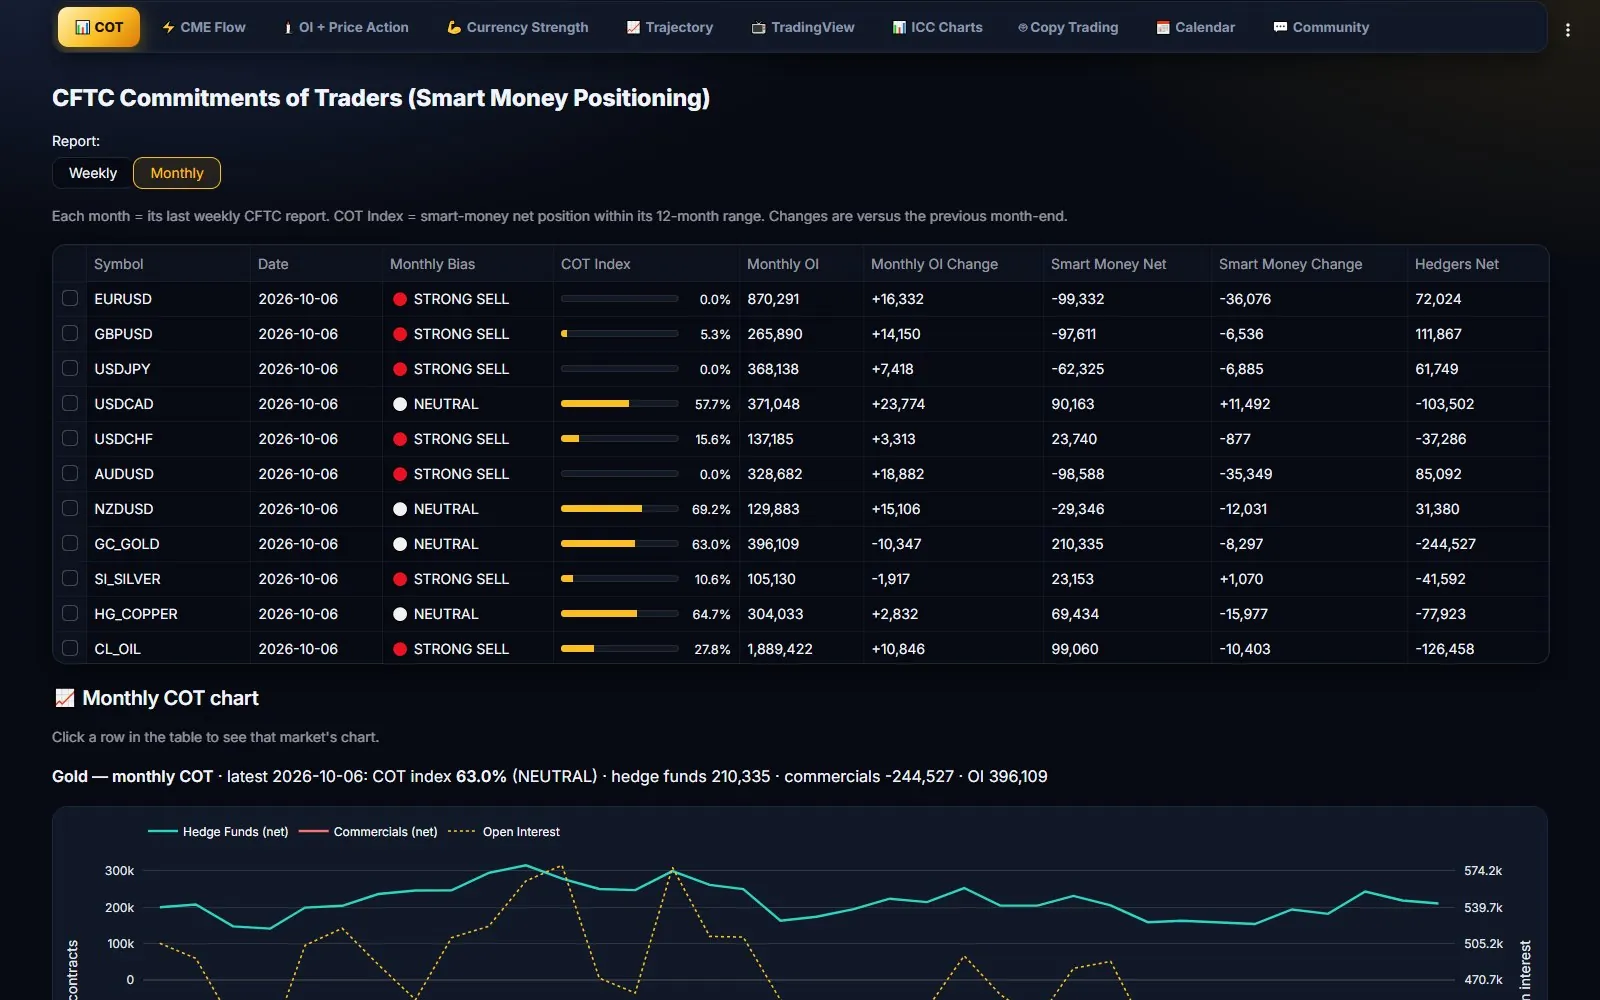
- COT Index here measures the smart-money net position inside its 12-month range.
- Monthly Bias: STRONG BUY at 70% or higher, STRONG SELL at 30% or lower, otherwise NEUTRAL.
- Smart Money Change and Monthly OI changes are compared with the previous month-end.
CME Daily Flow & signals
The tab CME Flow (in the app: Markets → CME) shows every trading session from CME Group. Pick the session with Select Trading Session, the view (Daily Session or 5-Day Bias) and a sector filter.
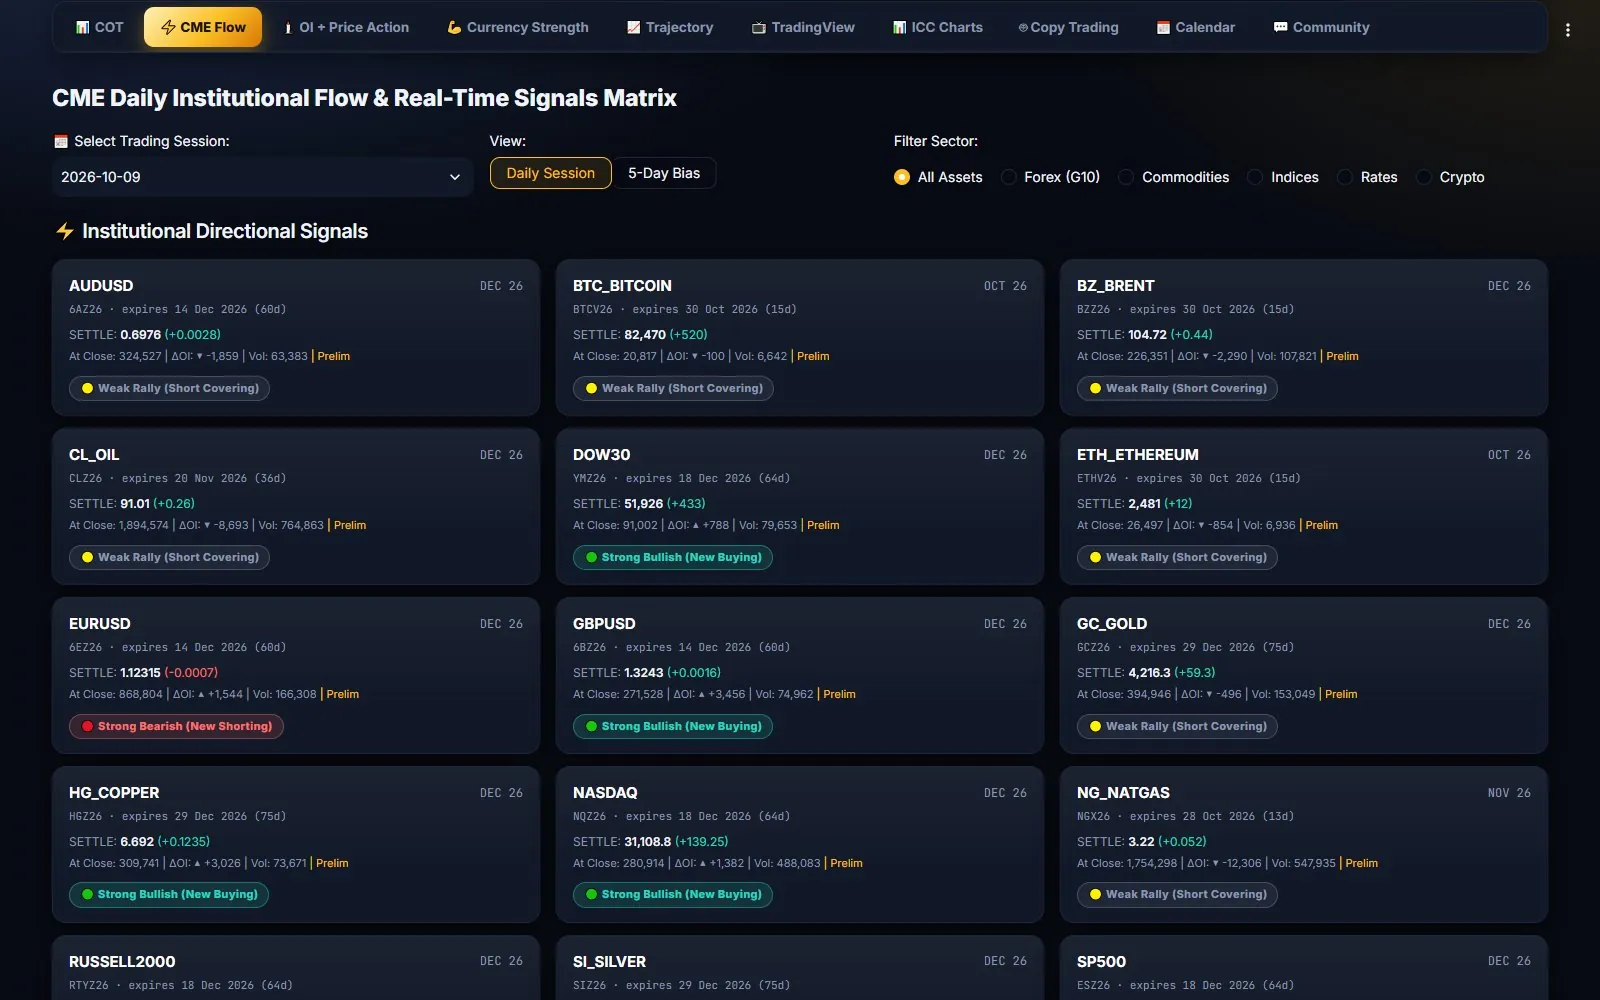
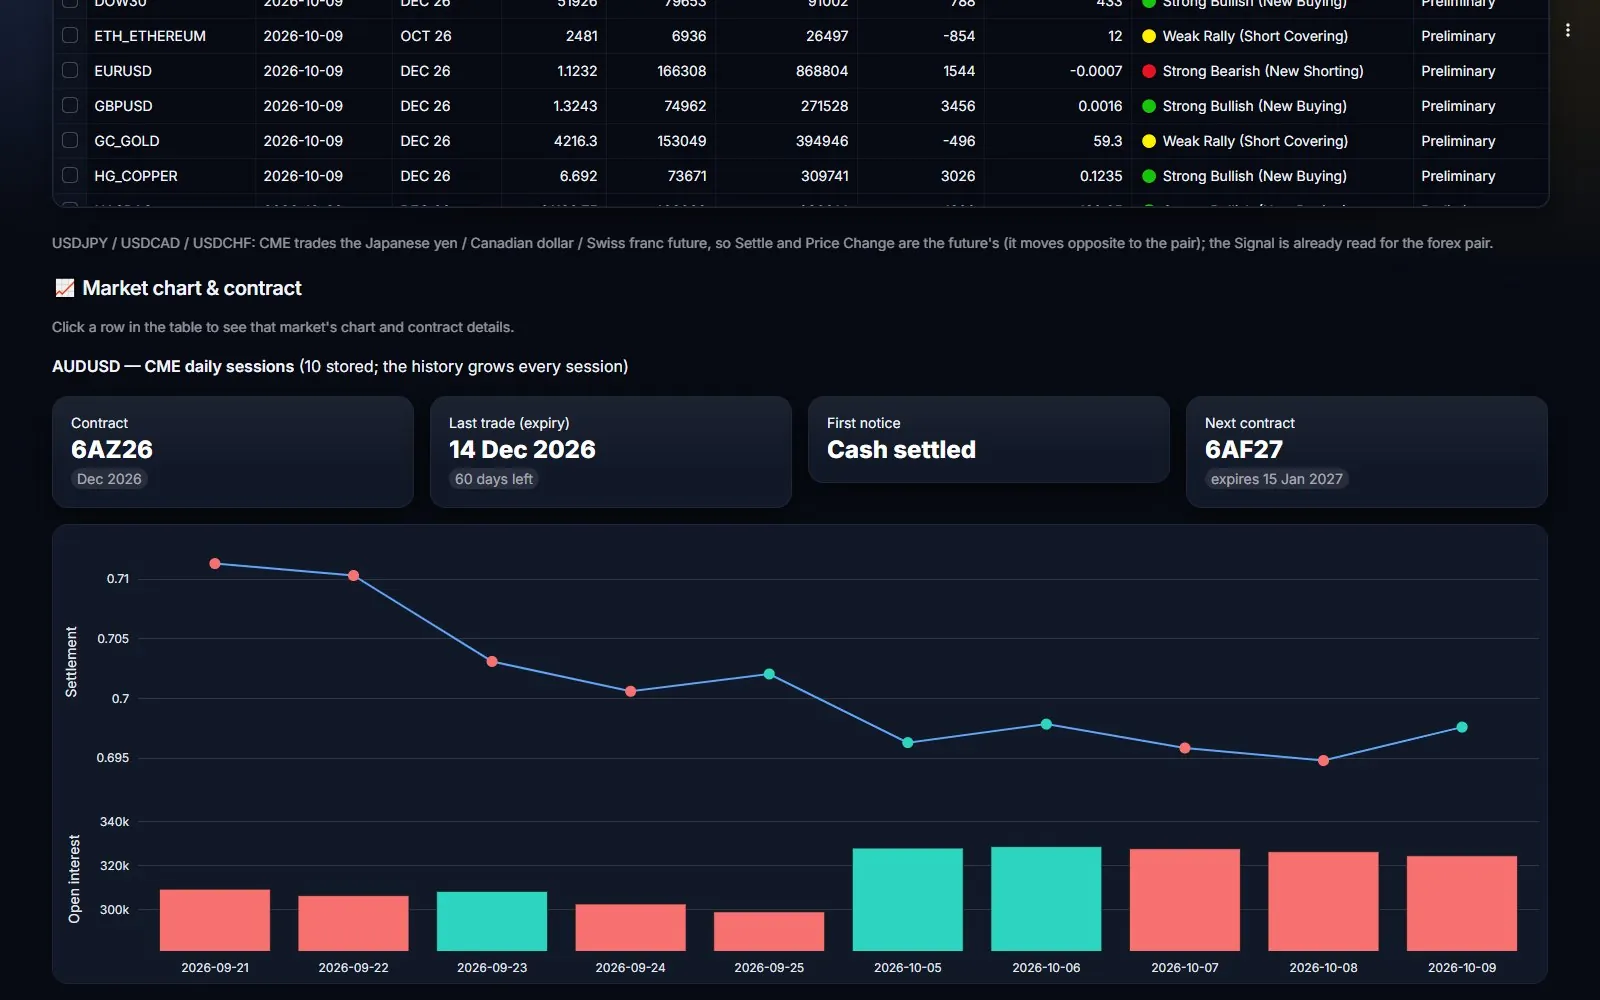
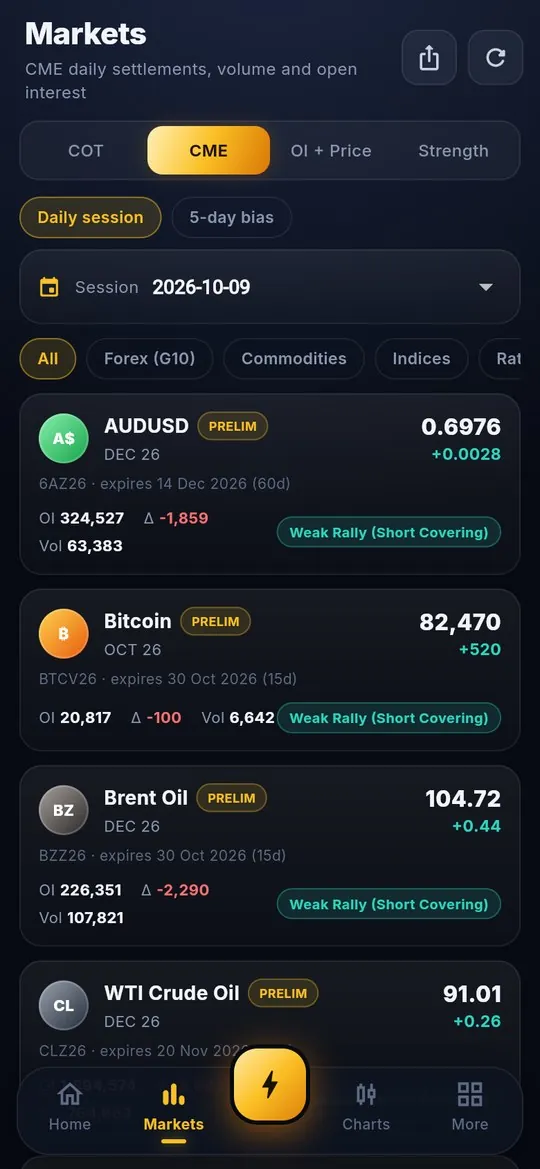
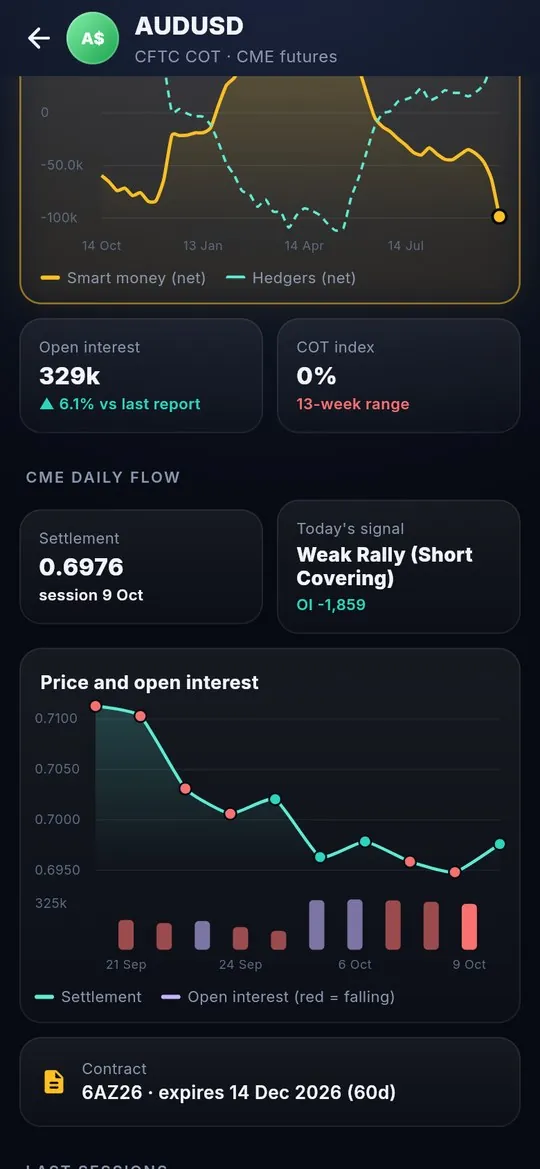
Each signal card shows
- Symbol and the active contract month, plus the contract code and expiry date, e.g.
GCZ26 · expires 29 Dec 2026 (93d). The line turns gold when the contract is close to expiry and a roll to the next month is coming. - SETTLE — the official settlement price and its change from the previous session.
- At Close — open interest at the close; ΔOI — its change; Vol — the volume traded.
- Prelim — CME’s preliminary figures; they are replaced by the final numbers at the next update.
What the signal means — price and open interest together
| Price | Open interest | Signal | Meaning |
|---|---|---|---|
| ▲ up | ▲ up | Strong Bullish (New Buying) | New buyers are entering — strongest bullish sign. |
| ▲ up | ▼ down | Weak Rally (Short Covering) | Sellers are closing — the rise may not last. |
| ▼ down | ▲ up | Strong Bearish (New Shorting) | New sellers are entering — strongest bearish sign. |
| ▼ down | ▼ down | Weak Drop (Long Liquidation) | Buyers are closing — the fall may not last. |
Below the cards, the Session Flow Table lists all markets. Click a row (in the app: tap a card) to see Market chart & contract: the settlement history coloured by signal, open interest over time and the contract details.
The 5-Day Bias
Choose 5-Day Bias in the CME tab. The last five sessions of each market are combined into one number, so one noisy day does not fool you.
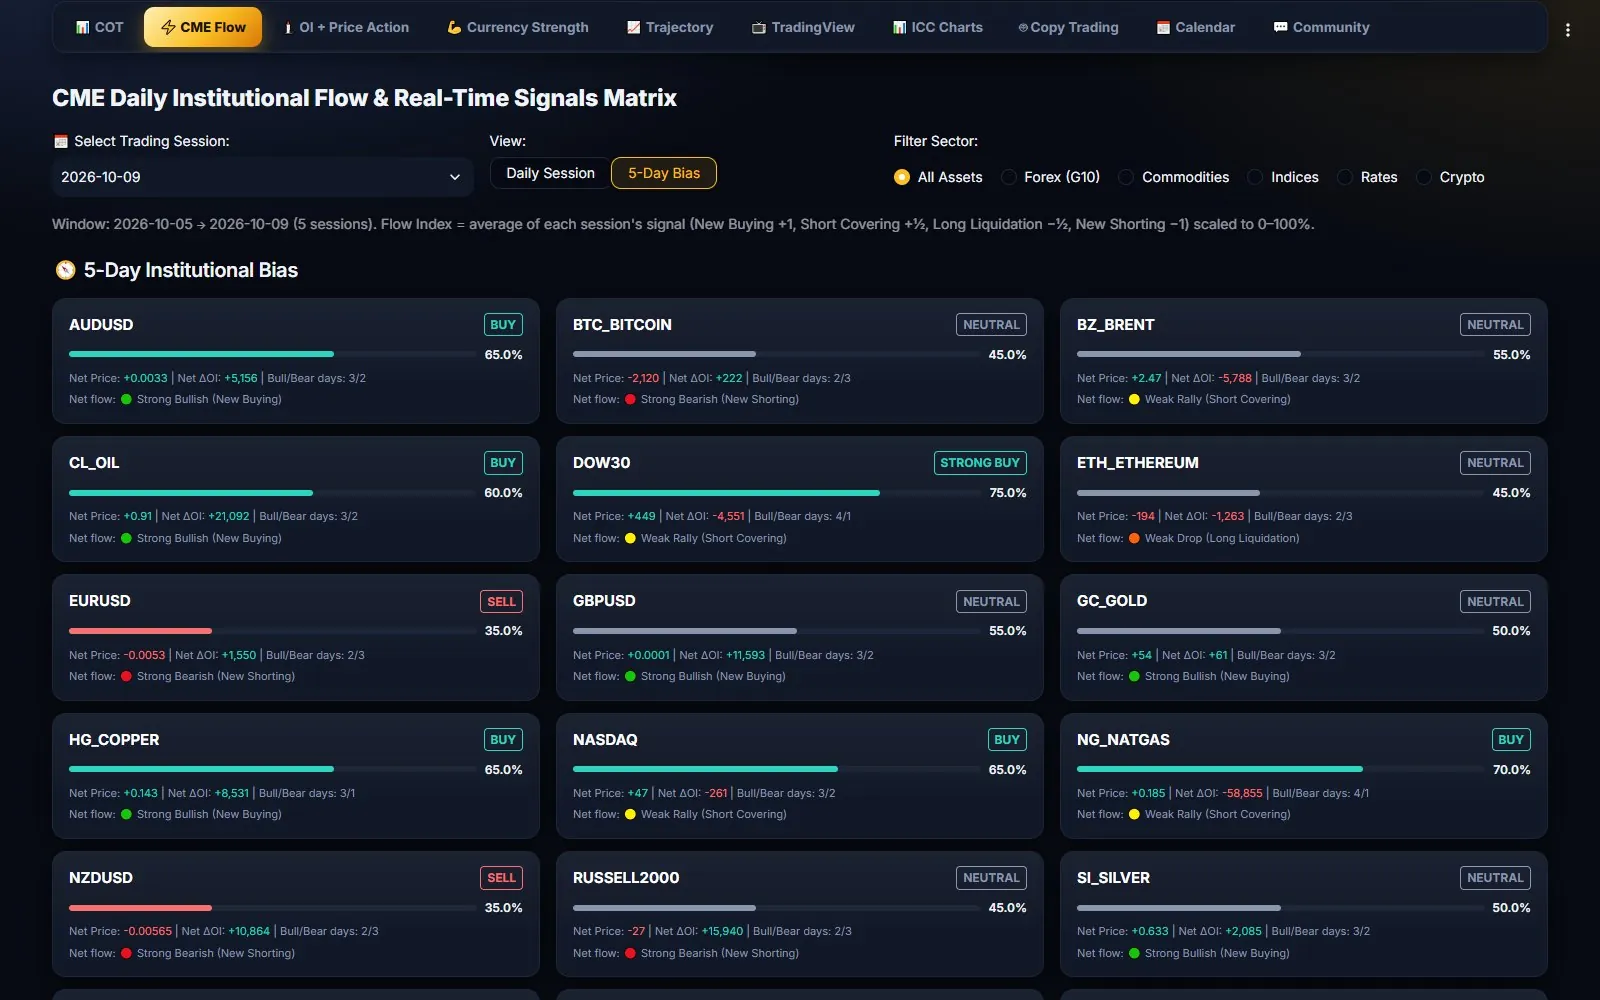
- Each session scores: New Buying +1, Short Covering +½, Long Liquidation −½, New Shorting −1.
- Flow Index = the average score on a 0–100% scale (100% = five days of new buying, 0% = five days of new shorting).
- Bias: 75% or more STRONG BUY, 60% or more BUY, 25% or less STRONG SELL, 40% or less SELL, otherwise NEUTRAL.
- Bull / bear days, Net Price Chg, Net OI Chg and Net Flow show what happened over the whole window.
How to read OI flow (OI + Price Action)
The tab OI + Price Action (in the app: Markets → OI + Price) puts candles and open interest on one chart, so you can see who is behind every move. Choose a market and the Daily or Weekly view.
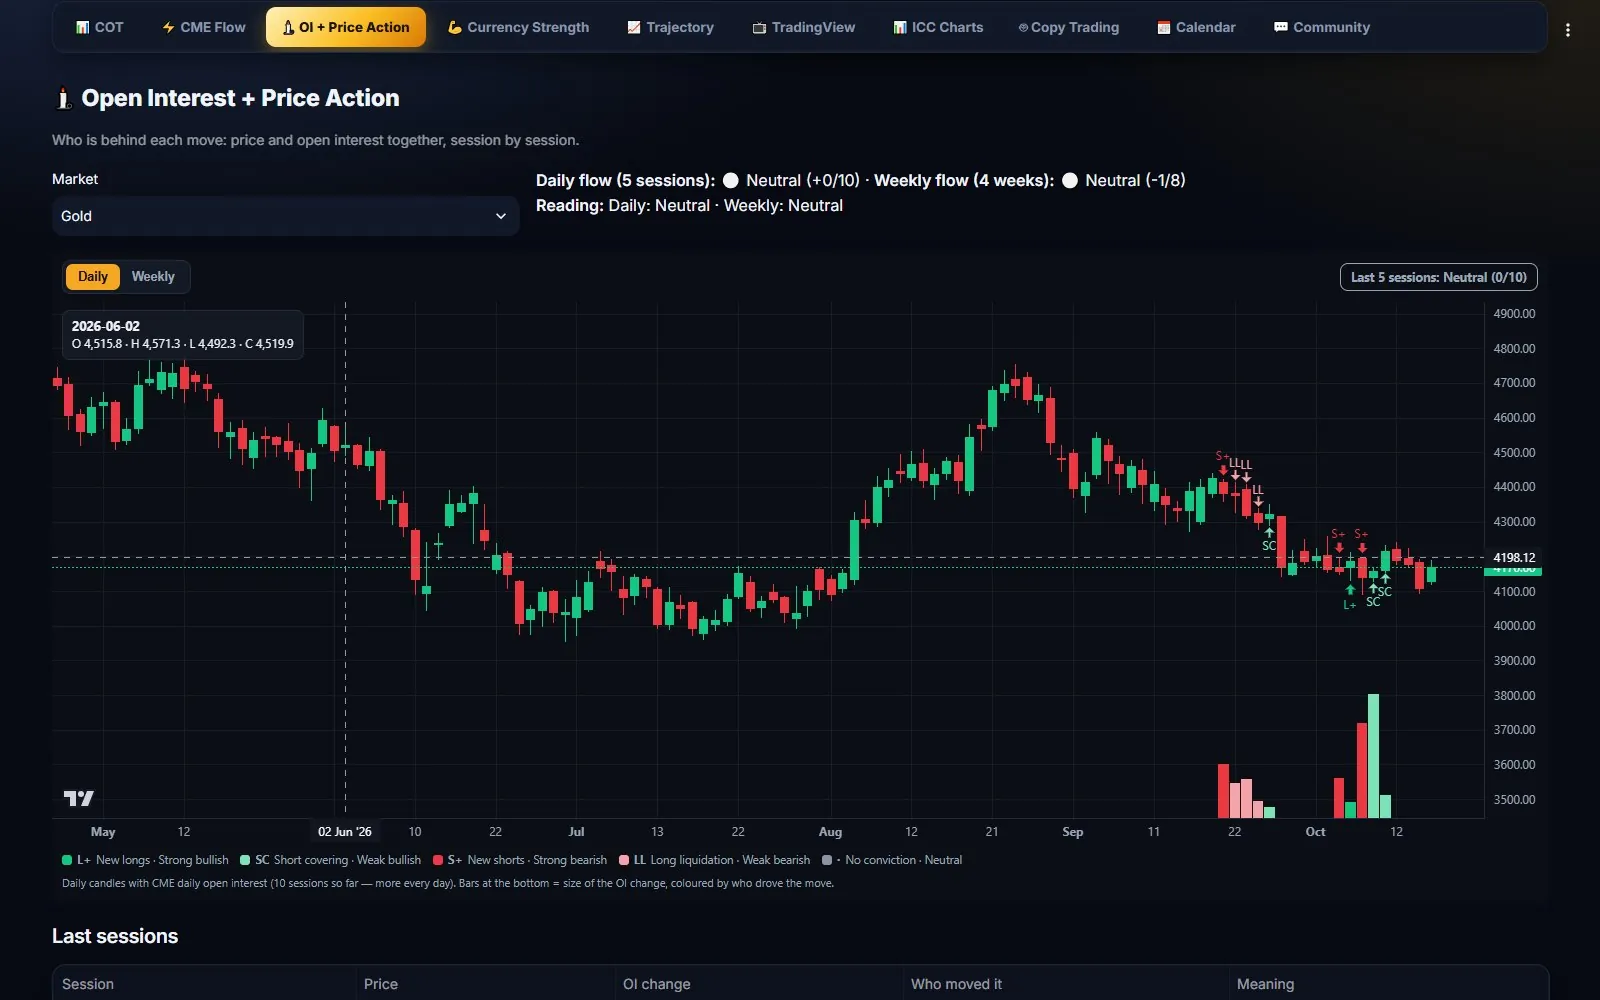
| Code | Name | Price / OI | Score |
|---|---|---|---|
| L+ | New longs — strong bullish | ▲ price, ▲ OI | +2 |
| SC | Short covering — weak bullish | ▲ price, ▼ OI | +1 |
| S+ | New shorts — strong bearish | ▼ price, ▲ OI | −2 |
| LL | Long liquidation — weak bearish | ▼ price, ▼ OI | −1 |
| · | No conviction — neutral | price or OI unchanged | 0 |
- Daily bias adds up the last 5 sessions (CME daily open interest); weekly bias adds up the last 4 CFTC reports.
- 60% or more of the maximum score = Strong Bullish, 30% or more = Bullish; the same on the negative side for Bearish / Strong Bearish.
- The summary line tells you whether daily and weekly flow agree (strongest) or the daily flow is against the weekly trend (be careful).
How to read the Currency Strength Matrix (CSM)
The Currency Strength Matrix ranks the 8 major currencies — USD, EUR, GBP, JPY, CHF, CAD, AUD, NZD — from strongest (top) to weakest (bottom), on a 0–100 scale.
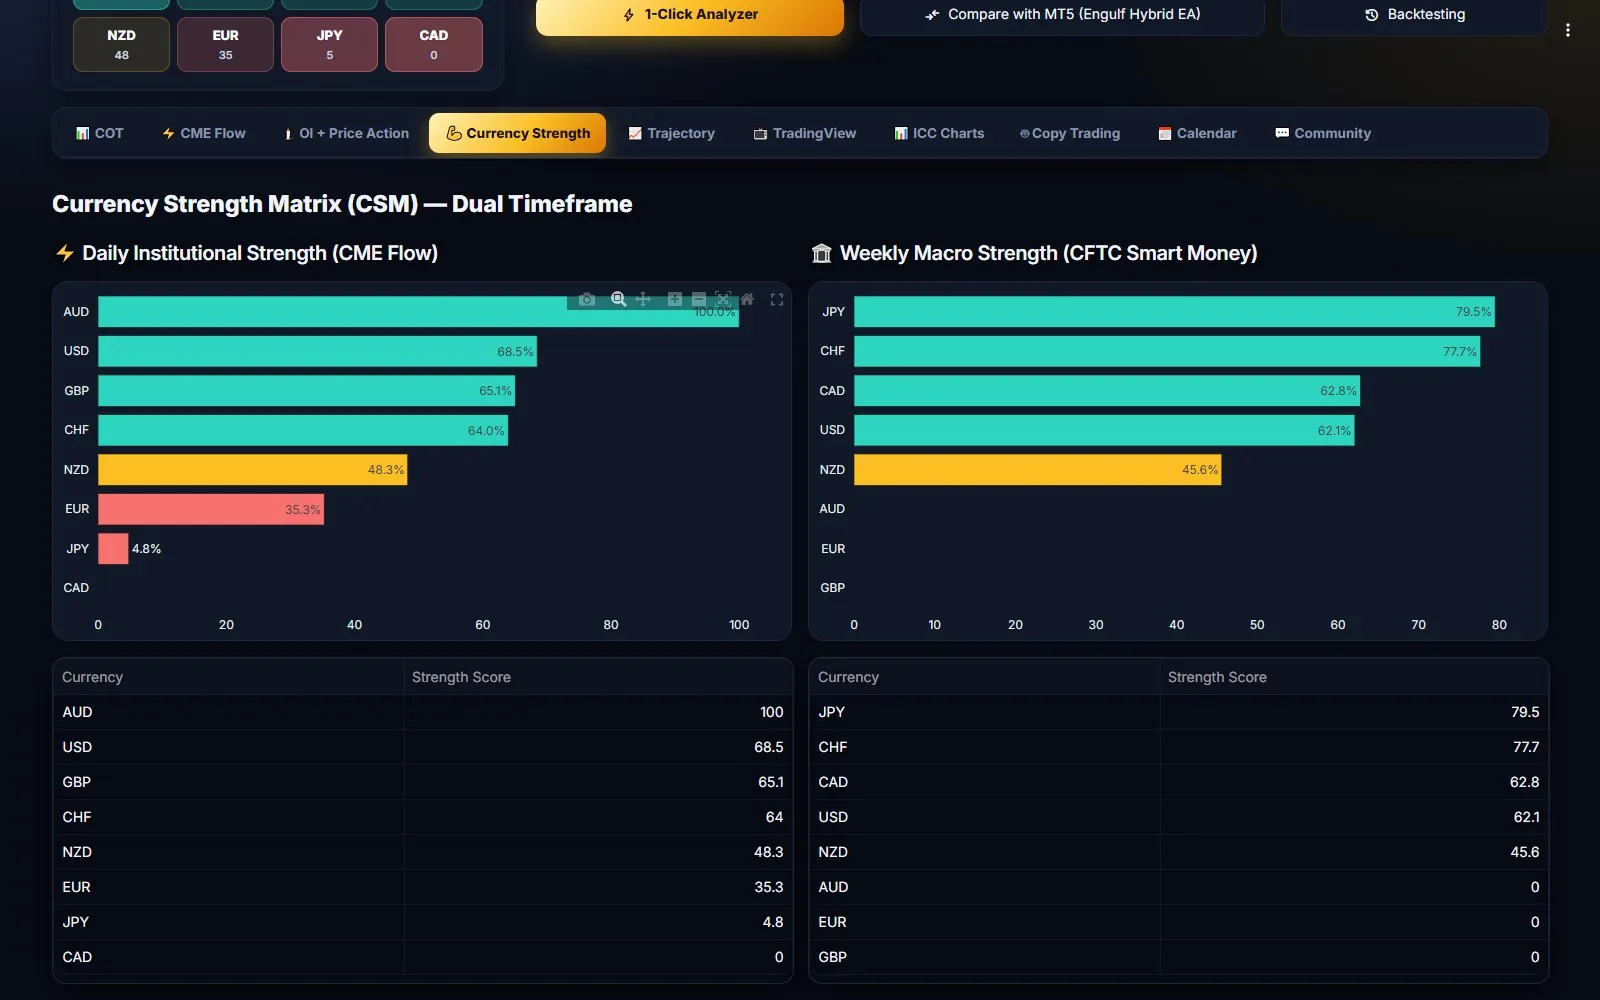
- Daily Institutional Strength (CME Flow) — from the latest CME session: the price change of each currency future weighted by its volume. Shows where money moved today.
- Weekly Macro Strength (CFTC Smart Money) — from each currency’s COT Index. Shows the bigger trend of the funds. USD is the average of the opposite side of all pairs.
How to use it
- Find a strong currency (top) and a weak currency (bottom).
- Trade the pair that combines them: strong EUR + weak JPY → look for buys on EURJPY; weak GBP + strong USD → look for sells on GBPUSD.
- Prefer pairs where the daily and weekly columns show the same picture.
Dual-Axis Trajectory
Pick a market in Trajectory. The chart shows the full COT history:
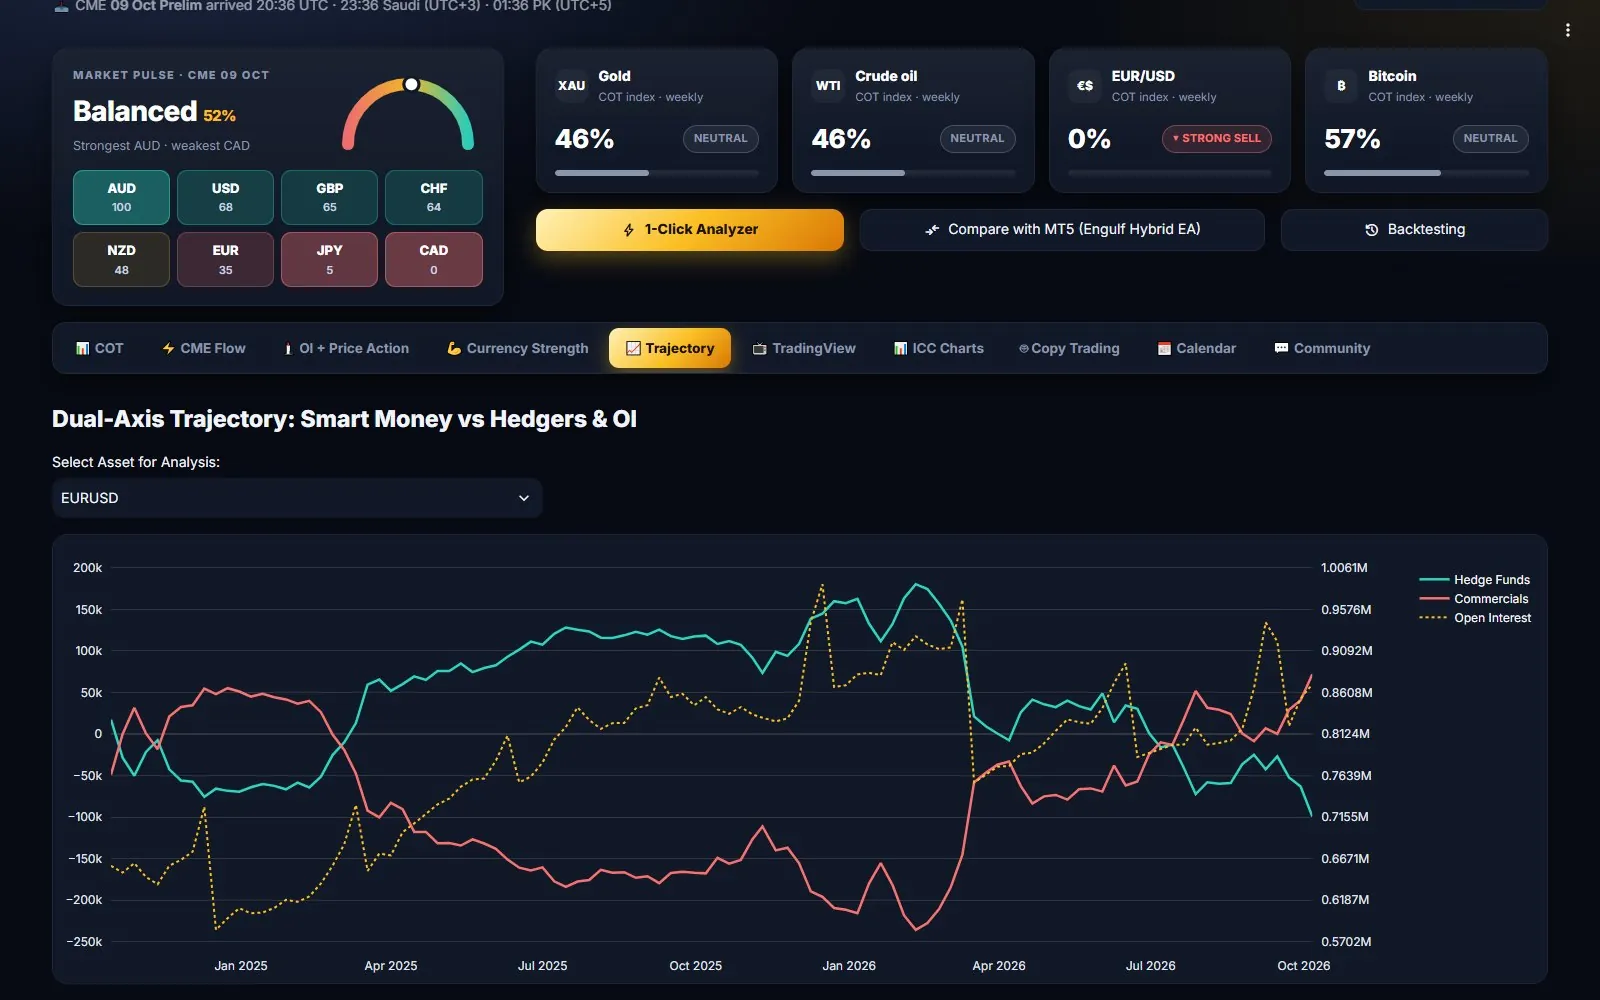
- Hedge Funds (green) — the net position of large speculators.
- Commercials (red) — the net position of hedgers; usually the mirror image.
- Open Interest (gold dotted line, right axis) — how much money is in the market.
- Hedge funds rising together with open interest = a healthy trend with new money.
- Hedge funds at an extreme far from their usual range while open interest falls = the trend is getting tired.
- The lines crossing or turning after a long move often mark the start of a new phase.
TradingView chart
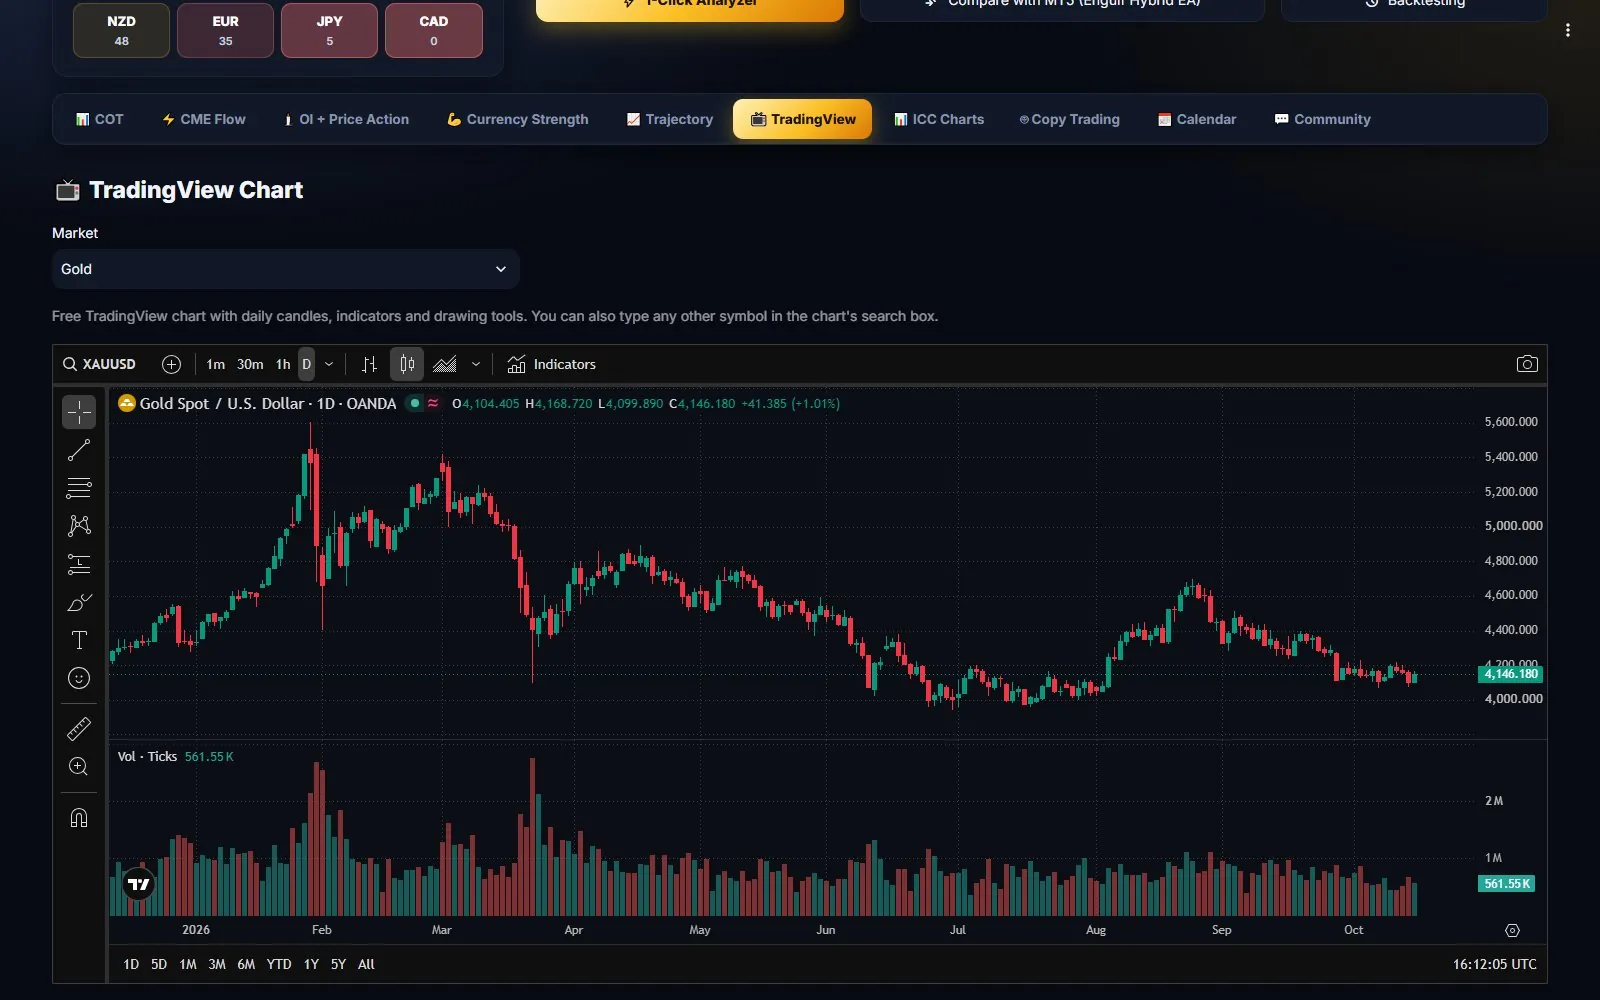
The TradingView tab gives you a free TradingView chart for every market with daily candles, indicators and drawing tools. Use it to mark support and resistance and to plan entries in the direction that the COT and CME flow show you.
Putting it together: a simple routine
A top-down routine many ICC Terminal users follow:
- Direction: check the monthly and weekly COT bias. Keep markets where both agree.
- Selection: for forex, use the CSM to pair a strong currency with a weak one.
- Confirmation: the 5-Day Bias and today’s CME signal should point the same way (New Buying for longs, New Shorting for shorts).
- Flow check: in OI + Price Action, the daily and weekly flow should agree.
- Timing: plan the entry, stop loss and target on the TradingView chart.
- Risk: risk only a small part of your balance per trade and respect the contract roll dates.
MT5 copy trading (VIP)
VIP members can copy the ICC master account into their own MetaTrader 5 account. The controls are in Copy Trading (web and Windows) and in the More → Trades & copy tab of the app.
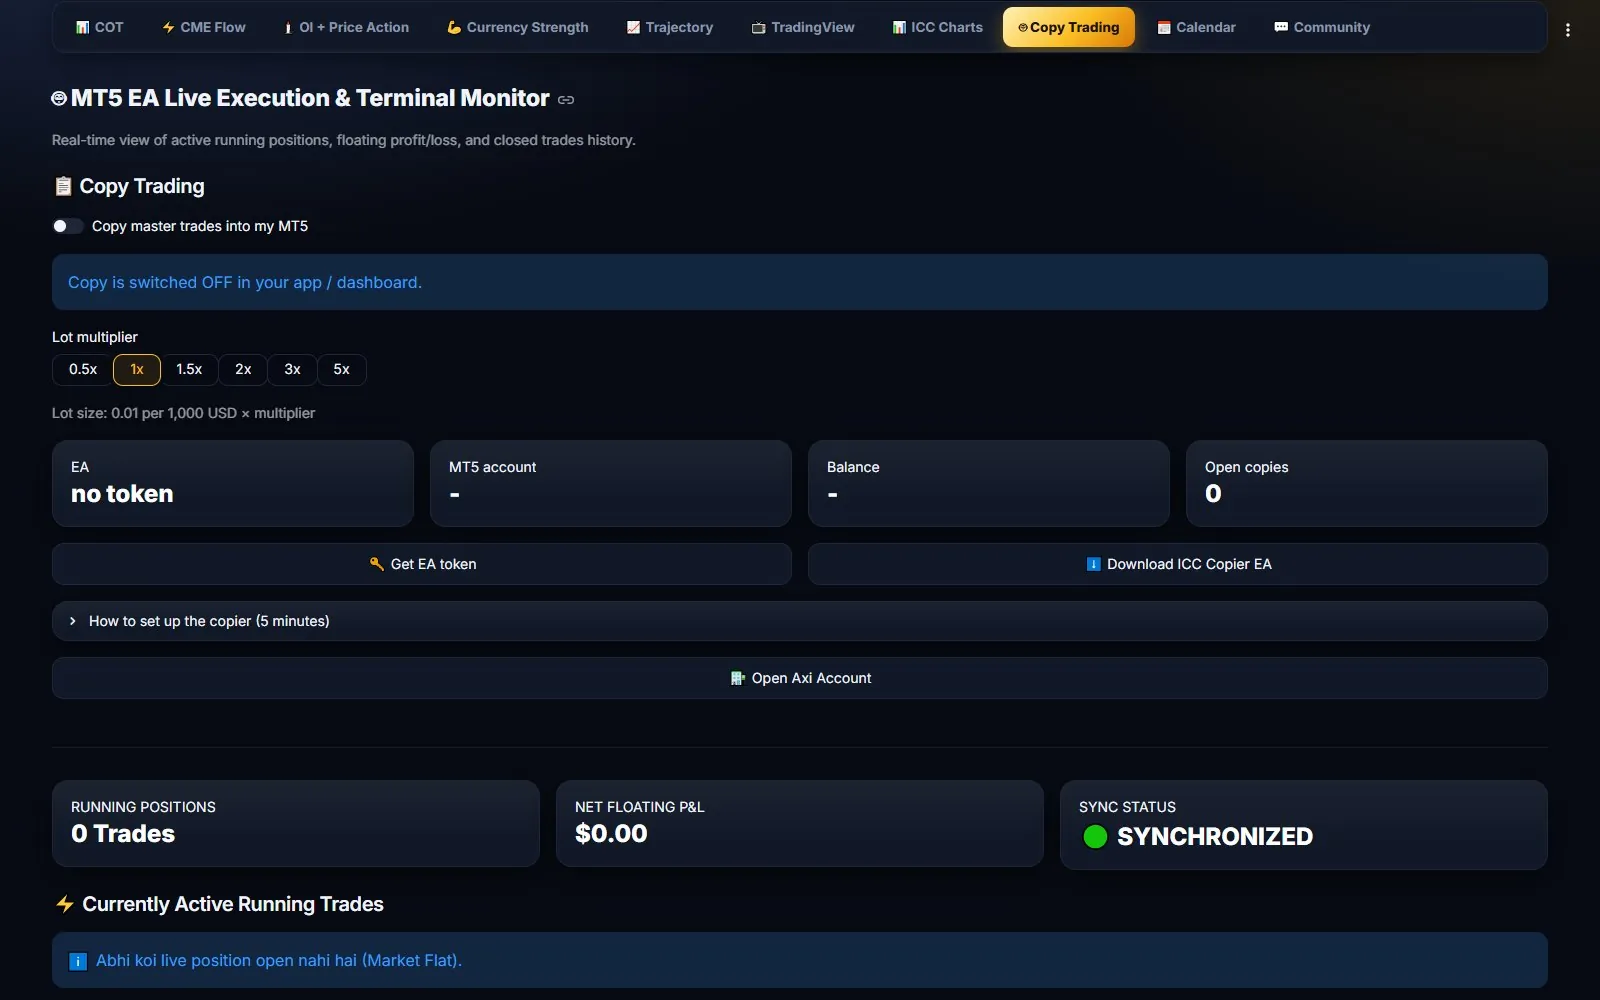
- Open a broker account (we recommend Axi — button in the app) and install MT5 on a PC or VPS that runs 24/5. MT5 on a phone cannot run EAs.
- Download the ICC Copier EA and copy
ICC_Copier.ex5into MT5: File → Open Data Folder → MQL5 → Experts, then restart MT5. - In MT5 open Tools → Options → Expert Advisors, tick Allow WebRequest for listed URL and add
https://api.iccterminal.trade. - Tap Get EA token, copy it (it is shown only once), drag ICC Copier onto any one chart and paste the token into the EA token input.
- Turn Copy master trades into my MT5 ON. The EA shows online within a minute.
- Lot size: 0.01 lot per 1,000 USD of balance × your Lot multiplier (0.5x to 5x).
- Stop loss, take profit and closes follow the master automatically. Turn copying off at any time.
Buy or renew a plan
Tap Buy next to a plan (app: My Account; web terminal: Buy plan). Prices are shown in USD and in your local currency.
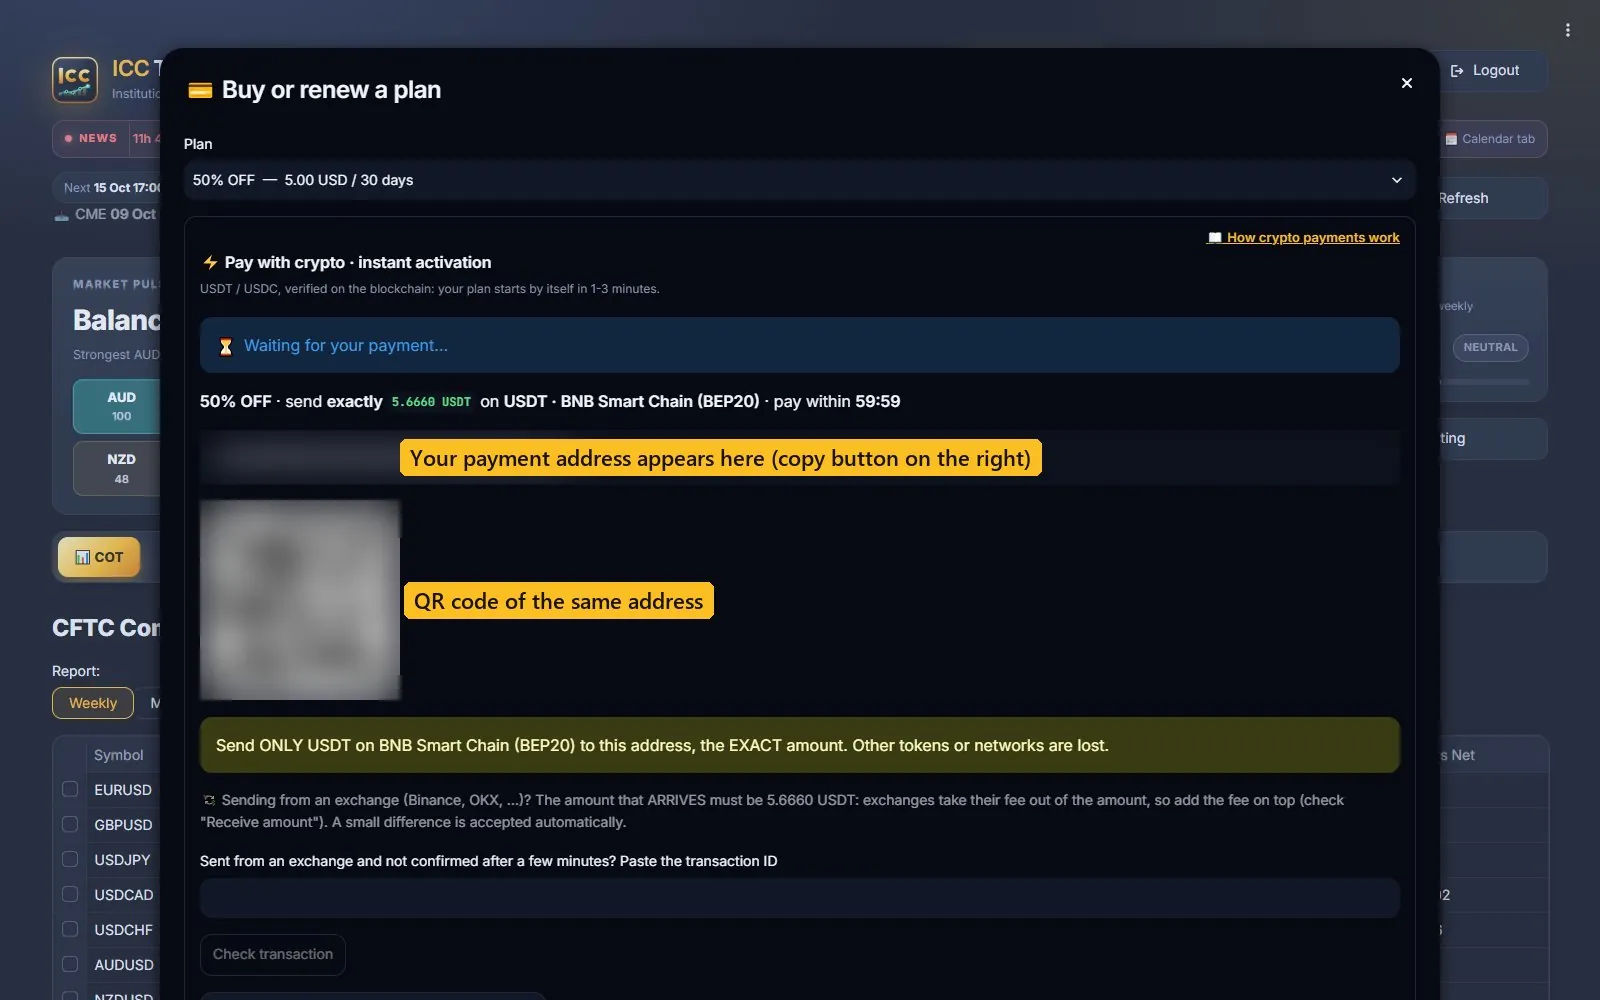
- Choose the plan, then the network you send from: USDT on TRON (TRC20), USDT on BNB Smart Chain (BEP20) or USDC on Base.
- Send exactly the amount shown to the address shown (copy it or scan the QR code) within 60 minutes. The small unique part of the amount (under 1 USD) is how we recognise your payment.
- The payment is checked on the blockchain and your plan starts by itself, usually within a few minutes, on all your devices. My payments shows the status.
- Sending from an exchange? The amount that arrives must match, so add the exchange's withdrawal fee on top. Not confirmed after a few minutes? Paste the transaction ID in the payment box.
App settings
Open More → Settings in the app.
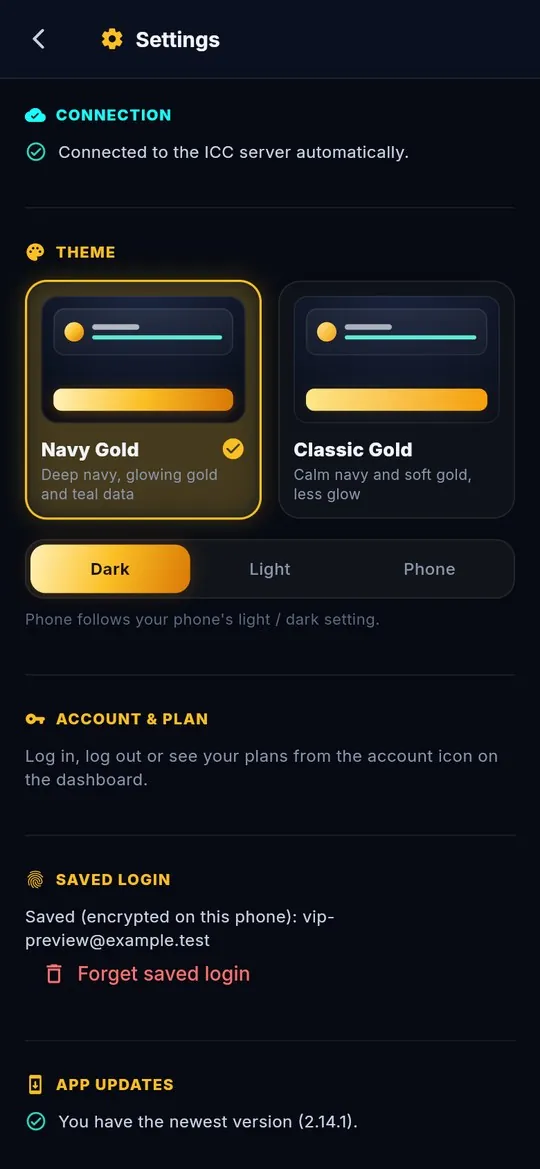
- Connection — shows whether the app is connected to the ICC server.
- Theme — Navy Gold or Classic Gold, each in Dark, Light or Phone (follows your phone).
- Saved login — switch Log in with fingerprint on or off, or tap Forget saved login to remove the saved login from this phone.
- App updates — shows your app version and tells you when a newer one is ready.
Problems & questions
“App not installed” or “update your Android” when installing
Download the newest APK from iccterminal.trade — it supports Android 6 to Android 16 and new 16 KB phones. If it still fails: delete the old downloaded file, download again over Wi-Fi, and allow Install unknown apps for your browser. As a last try, uninstall the old ICC Terminal app first, then install.
“The ICC server is taking too long to answer”
Check your internet and tap Retry. During the daily update (around 01:00 and 17:00 UTC) the server can be busy for a moment.
I see 🔒 VIP only
That part needs a VIP plan. Buy a plan as shown above, or contact support.
Too many devices
Your plan allows a set number of devices at the same time. Log out on a device you no longer use, or contact support.
Why is today’s CME data not there yet?
CME publishes after each session; ICC Terminal picks it up at the next update. Numbers marked Prelim are replaced by the final ones automatically.
Support
WhatsApp: +92 330 4040740 — or tap Need help? Contact support in the app.
Risk warning
ICC Terminal shows market data and statistics for education and analysis. It is not financial advice and past positioning does not guarantee future results. Trading forex, commodities, indices and crypto on margin carries a high level of risk and may not be suitable for everyone. Only trade money you can afford to lose.
The5%ers Partner link If you trade a prop firm account, its own daily and total loss limits come first. We may earn a commission if you buy through it. Prop firm challenges are paid evaluations; most traders don't pass. Trade only what you can afford to lose.