
The COT Index Explained: How to Read 0–100% Positioning
A raw COT number such as “funds are net long 180,000 contracts” means little on its own. The COT index turns it into a simple 0–100% reading you can compare across markets and over time. Here is how it works and how traders use it.
Why raw COT numbers are hard to read
The Commitments of Traders report tells you how many futures contracts each group of traders holds. The problem is scale. A net long of 50,000 contracts is huge in platinum and tiny in the S&P 500. Even inside one market, what counts as “a lot” changes from year to year as open interest grows or shrinks.
So experienced COT readers rarely look at the raw net position alone. They ask a better question: compared with its own recent history, is this position high or low? The COT index answers exactly that.
How the COT index is calculated
The idea is simple. Take the net position of the large speculators (non-commercials: hedge funds, CTAs, money managers) over a lookback window. Find the lowest and the highest net position in that window. Then place this week's value between them:
If the highest and lowest are the same (no range yet), the index is set to 50%.
- 100% — speculators are as long as they have been in the whole window.
- 0% — they are as short (or least long) as they have been.
- 50% — right in the middle of their recent range.
Because it is a percentage of the market's own range, the COT index of gold can be compared directly with the COT index of the Japanese yen or crude oil.
How ICC Terminal computes it
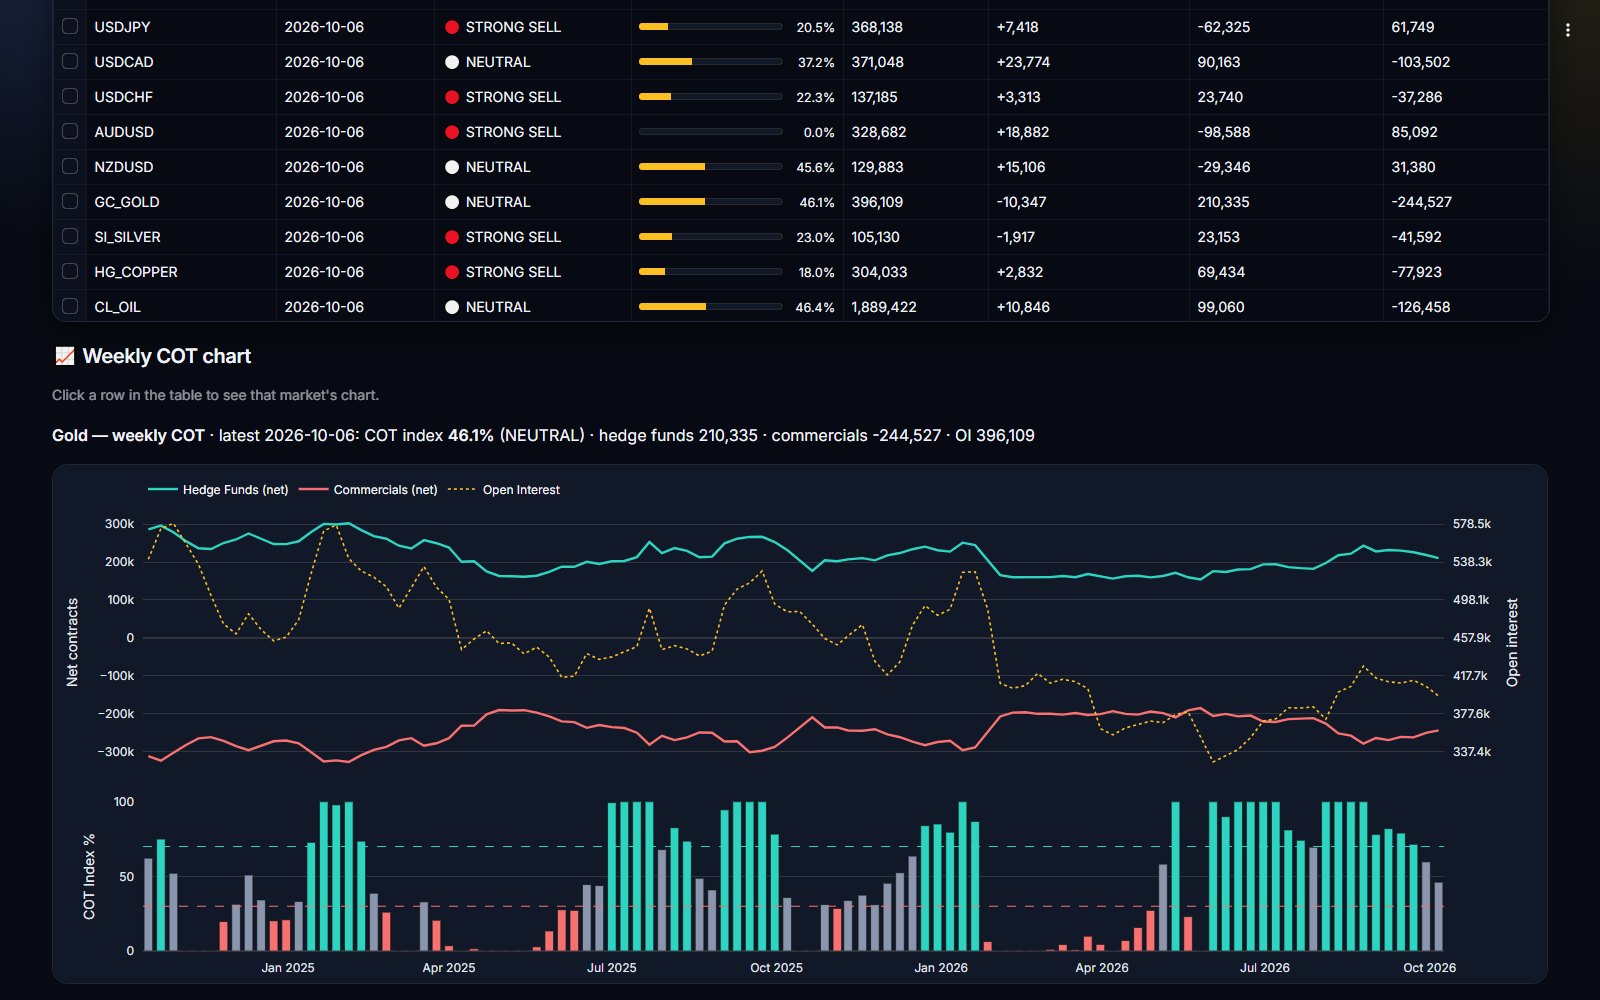
ICC Terminal downloads the CFTC report every week and builds two versions of the index for 42 markets:
| View | Window | Bias rule |
|---|---|---|
| Weekly COT | The last 13 weekly reports (about a quarter) | 70% or more = STRONG BUY, 30% or less = STRONG SELL, otherwise NEUTRAL |
| Monthly COT | The last 12 month-end reports (the last report of each month) | Same 70 / 30 thresholds |
The weekly index reacts quickly to new buying or selling; the monthly index shows whether that move matters in the bigger picture. When both point the same way, positioning is consistent across time frames.
For pairs where CME trades the other currency — USDJPY, USDCAD, USDCHF, USDMXN, USDZAR and USDBRL — ICC turns the speculators' net position around before computing the index, so a high reading always means bullish for the pair as you trade it. You can read more about this in the forex COT guide.
Reading extremes
The most useful readings are the extremes. They tell you a trade is crowded:
- Near 100% for several weeks — speculators are heavily long. Trend followers are already in, so there are fewer new buyers left. The trend can continue, but it becomes fragile: bad news can trigger fast long liquidation.
- Near 0% for several weeks — speculators are heavily short. A short squeeze becomes possible if price starts to rise.
- Leaving an extreme — when the index falls from 90%+ back below 70%, speculators have started to reduce longs. This turn is often more important than the extreme itself.
Two ways of trading the index are common. Trend traders stay with markets where the index is high and rising (or low and falling) and treat 70 / 30 as confirmation. Contrarian traders wait for an extreme, then look for price to turn before taking the other side. Both need price confirmation; the index alone does not tell you when.
Combine it with daily data
The COT report is weekly and three days old when it is published (data from Tuesday, released Friday at 3:30 PM New York time). For timing, combine it with daily information:
- Use the weekly and monthly COT index to choose the direction.
- Use the CME daily flow — price and open interest together — to see whether fresh money is entering in that direction today.
- Use your own chart levels and risk rules for the actual entry and stop.
Pitfalls to avoid
- Short history. A 13-week window adapts fast, which also means a market that has trended for months can sit at 100% for a long time. Check the monthly index too.
- Treating 100% as “sell now”. Extremes can last. Wait for the index to turn and for price to confirm.
- Ignoring open interest. A high index with falling open interest means speculators are long in a shrinking market, a weaker signal than a high index with rising open interest.
- Forgetting the delay. Big moves on Wednesday or Thursday are not in Friday's report yet.
A worked example
Suppose over the last 13 weeks the speculators' net position in gold ranged from a low of 120,000 contracts to a high of 220,000. This week it is 200,000. The COT index is (200,000 − 120,000) ÷ (220,000 − 120,000) × 100 = 80%. That is above 70%, so the weekly bias reads STRONG BUY: funds are close to the top of their recent range.
Now say the following week the net position drops to 170,000. Nothing dramatic happened to the raw number — funds are still heavily long — but the index falls to 50%. That change tells you speculators have started to take profit, which is exactly the kind of turn worth watching on the chart.
The same arithmetic applies to every market, which is why a dashboard of COT index values lets you scan 42 markets in a minute and pick out the few where positioning is stretched or turning.
Weekly and monthly COT index for 42 markets
ICC Terminal shows the COT index, net positions and the weekly / monthly bias for forex, gold, oil, indices, rates and crypto, updated automatically every week. See the user guide for a walk-through.
FAQ
What is a good COT index reading?
There is no good or bad reading. Above 70% shows strong bullish speculator positioning, below 30% strong bearish positioning. Readings near 0% or 100% show a crowded trade.
Why does ICC use 13 weeks for the weekly COT index?
Thirteen weekly reports cover about one quarter, which reacts quickly to new positioning. The monthly view uses 12 month-end reports for the bigger picture.
Can the COT index stay at 100% for long?
Yes. In strong trends speculators can stay at the top of their range for weeks. Wait for the index to turn and for price to confirm before trading against it.