
Gold COT Report: How Funds and Hedgers Move the Gold Price
Gold reacts to interest rates, the dollar and fear — but the moves you see on your XAUUSD chart are driven by who is buying and selling COMEX gold futures. The weekly COT report shows exactly that. Here is how to read it.
Why the COT report matters for gold
Most of the world's gold price discovery happens in the COMEX gold future traded on CME Group. Banks, hedge funds, miners and jewellers all meet there. Every Friday the US regulator, the CFTC, publishes the Commitments of Traders (COT) report, which counts how many gold futures each type of large trader holds long and short as of that Tuesday.
For a gold trader that is valuable information you cannot get from the chart alone: is the big money still adding to its bets, or has it already bought everything it wants to buy?
Who trades gold futures
The CFTC publishes the data in several formats. ICC Terminal reads the classic legacy futures report, which splits large traders into two main groups. The newer disaggregated report splits the same traders more finely; the table shows how the names fit together.
| Legacy report (used in ICC) | Disaggregated report | Who they are in gold |
|---|---|---|
| Non-commercials (large speculators) | Managed money, other reportables | Hedge funds, CTAs and other funds that trade gold for profit — the group most traders call smart money. |
| Commercials (hedgers) | Producers / merchants, swap dealers | Miners selling future production, refiners and jewellers, and the banks that hedge gold deals for their clients. |
| Non-reportables | Non-reportables | Small traders below the reporting threshold. |
Commercials are structurally net short gold: a miner that sells its next year's output forward is short by design. That is why their position moves opposite to the speculators and why most traders follow the speculators' net position instead. The article smart money vs hedgers explains the difference in detail.
Reading the gold net position
- Net position = speculators' long contracts minus their short contracts. In gold it is usually positive, because funds hold gold as a long-term asset.
- Weekly change — the most useful number in the short term. Funds adding tens of thousands of contracts in a week is fresh conviction; a falling net long while price rises means the rally is running on less fuel.
- Open interest — all open gold contracts. A rising price with rising open interest means new money is joining the move.
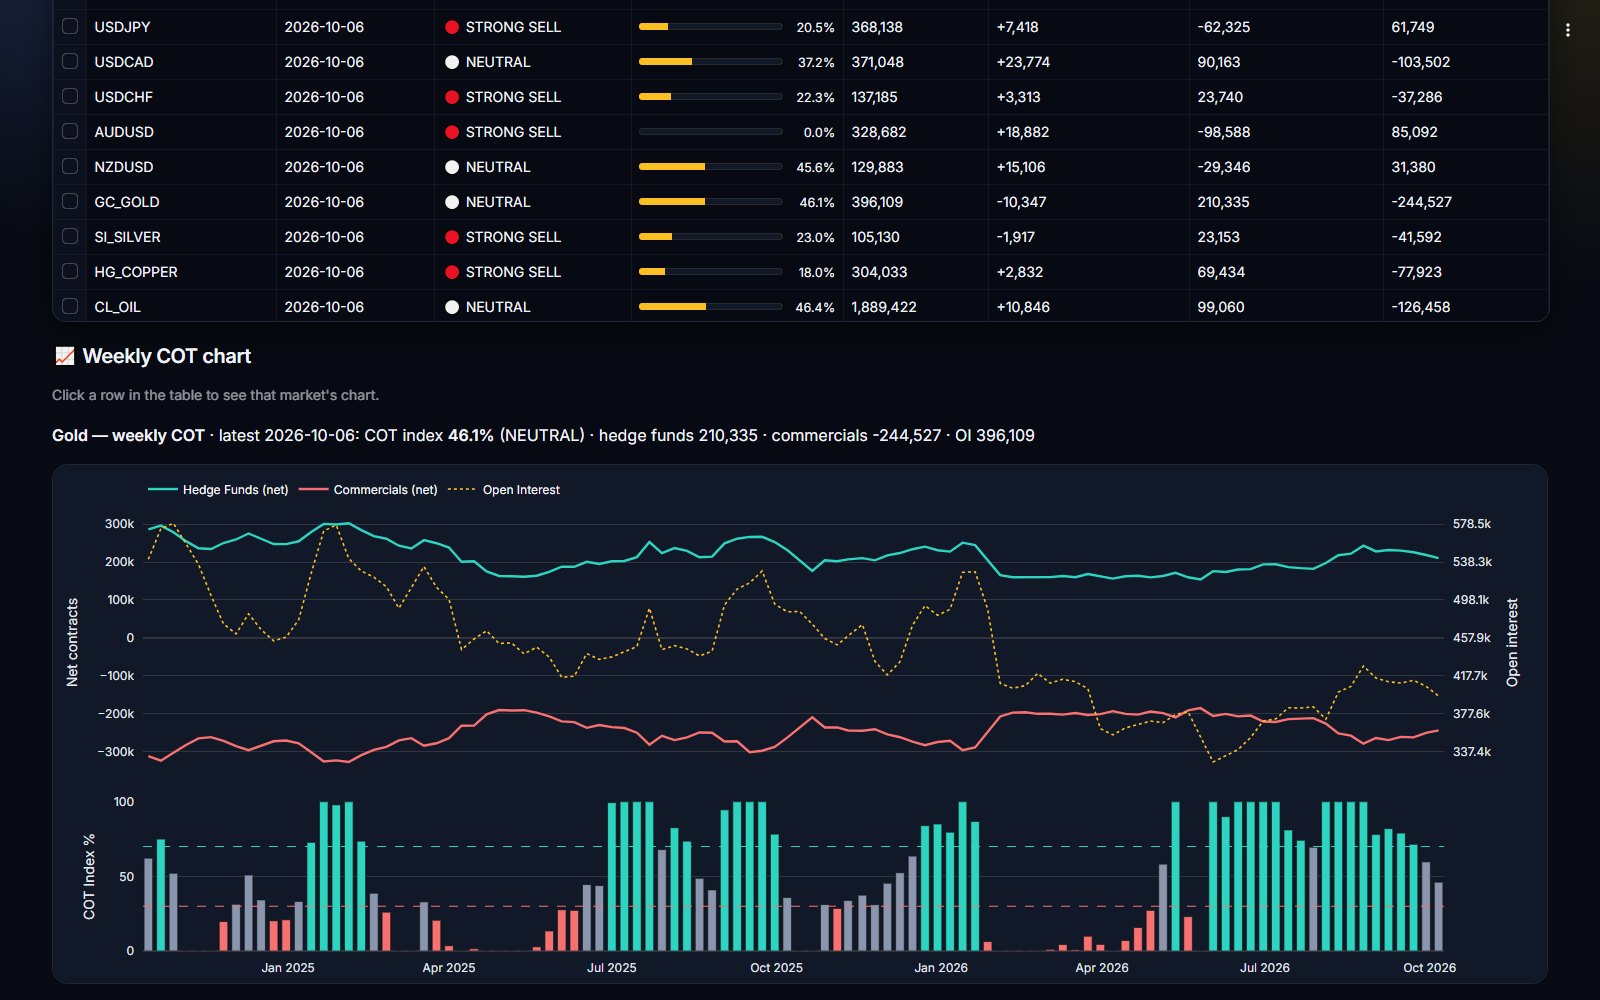
The gold COT index
Because gold speculators are almost always net long, the raw number is hard to judge. The COT index solves this: it shows where the current net position sits inside its own recent range, from 0% (the most bearish reading of the period) to 100% (the most bullish).
In ICC Terminal the weekly COT index uses the last 13 weekly reports. A reading of 70% or more is shown as STRONG BUY, 30% or less as STRONG SELL, and anything in between as neutral. The monthly COT view uses a 12-month range for the bigger picture.
Timing with the CME daily flow
The COT report is weekly and three days old when it comes out. To time trades, combine it with daily data:
- CME daily flow. CME publishes gold volume and open interest every session. ICC Terminal reads each session as new buying, short covering, new shorting or long liquidation and adds them up into a 5-day bias.
- OI + price action. The open interest + price action view marks every daily candle with who moved it, so you can see whether a breakout was new buying or just shorts closing.
- Contract calendar. Gold has active months in February, April, June, August, October and December. Around the first notice day of the front contract, open interest drops as traders roll — ICC shows the next expiry and first notice date so a roll is not mistaken for liquidation.
The strongest set-ups appear when the weekly picture (funds adding longs, COT index rising) and the daily picture (new buying sessions) point the same way.
A note on silver
Silver (SI_SILVER in ICC) has the same structure — speculators against producers and dealers — but the market is much smaller, so speculators can push it further and faster. Silver positioning often swings to extremes more quickly than gold. Read it the same way, with smaller position sizes.
A simple weekly routine
- Saturday: open the COT tab, select GC_GOLD, note the COT index, the net position and the weekly change.
- Decide the weekly direction: are speculators adding or cutting, and is the index near an extreme?
- During the week: check the CME flow and the 5-day bias each day for confirmation.
- Enter only with your own levels and a stop-loss; skip the week when weekly and daily data disagree.
Gold positioning, updated automatically
ICC Terminal shows the gold COT index, smart-money and hedger positions, the CME daily flow and the contract calendar in one place — on Android, Windows and the web. PMEX traders can follow the same data for PMEX gold.
FAQ
Which gold contract does the COT data in ICC Terminal use?
The flagship COMEX gold future (CFTC contract code 088691), the same contract whose open interest CME reports every day.
Is a large net long in gold bullish or bearish?
A rising net long shows funds are adding to the trend, which supports it. A net long that sits near its highest level for months shows a crowded trade, which raises the risk of a sharp pullback when buyers run out.
Can I use the gold COT report for XAUUSD and PMEX gold?
Yes. Spot XAUUSD, CFD gold and PMEX gold all follow the same international gold price, so the positioning of COMEX futures traders applies to all of them.