
Crude Oil COT Report: How Funds Position in WTI and Brent
Oil is one of the most traded futures markets in the world, and producers, refiners, airlines and hedge funds all show up in its COT report. Here is how to read their positions in WTI and Brent and what to combine them with.
WTI and Brent: two benchmarks
WTI (West Texas Intermediate) is the US benchmark, traded as light sweet crude futures on NYMEX, part of CME Group.
Brent is the international benchmark for oil from the North Sea and much of the world's trade. Both are covered in ICC
Terminal: WTI as CL_OIL and Brent as BZ_BRENT, each with weekly COT and CME daily data.
The two prices usually move together, but their spread changes with US supply, shipping costs and global demand. When positioning in one benchmark diverges from the other, it can hint at a regional rather than a global story.
Who trades oil futures
| Group | Examples | Typical behaviour |
|---|---|---|
| Speculators | Hedge funds, CTAs, commodity funds | Follow trends and macro themes; add longs on supply worries, shorts on demand worries |
| Producers (commercial) | Shale companies, oil majors | Sell futures to lock in prices, often after rallies |
| Consumers (commercial) | Refiners, airlines, shipping companies | Buy futures to fix costs, often after declines |
Because producers hedge more when prices are high, commercial net shorts in oil tend to grow in rallies. That is normal hedging, not a bearish forecast. See smart money vs hedgers for why.
Reading oil positioning
- Net position and its change. A speculator net long that grows for several weeks while prices rise shows a trend with support. A shrinking net long while prices are still rising warns that the move is losing fuel.
- COT index. ICC's weekly index places the speculator net inside its 13-week range; the monthly index uses 12 months. Readings near 100% or 0% mean crowded positioning, which makes oil prone to sharp reversals on news.
- Open interest. Rising open interest means new money is entering. A rally on falling open interest is often short covering rather than new buying.
Add the daily flow
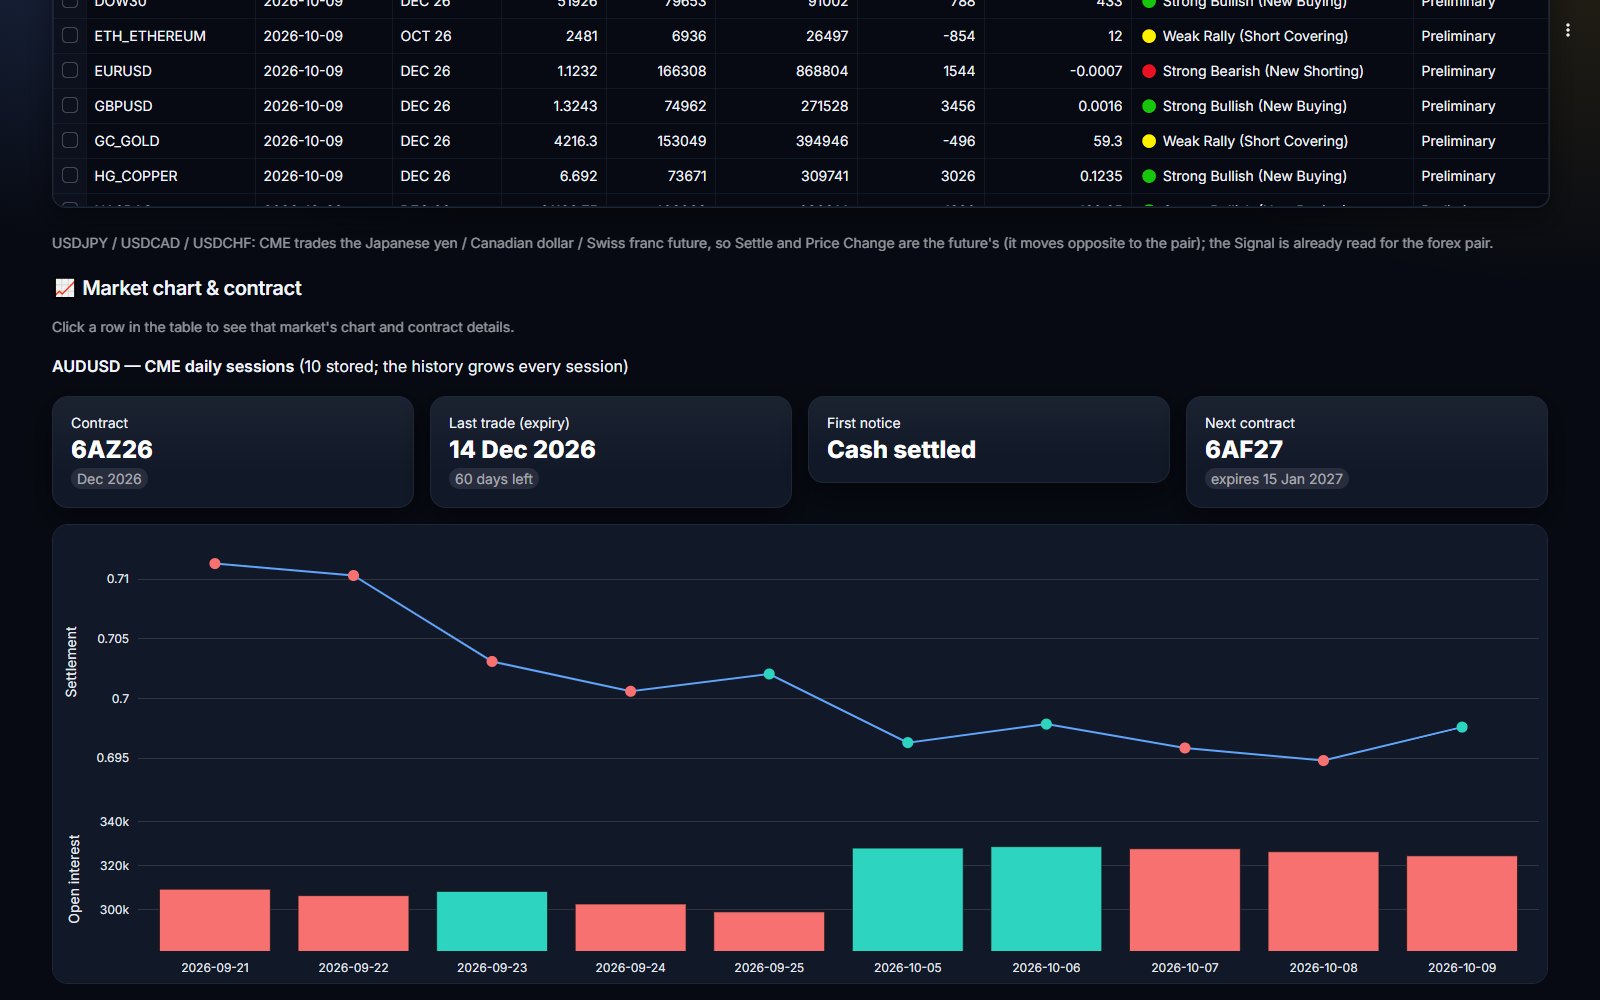
Oil reacts quickly to inventory data, OPEC+ decisions and geopolitical headlines, so a weekly report cannot tell you what happened yesterday. The CME daily flow fills that gap. Each session is labelled by price and open interest together:
- New buying — price up, OI up: fresh longs.
- Short covering — price up, OI down: shorts closing.
- New shorting — price down, OI up: fresh shorts.
- Long liquidation — price down, OI down: longs closing.
ICC's 5-day bias scores the last five sessions into a flow index from 0% to 100%. When the weekly COT direction and the 5-day flow agree, positioning is consistent across time frames.
Seasonality and other cautions
- Seasonal demand. Summer driving season and winter heating can shift demand for products like gasoline and heating oil, which feeds back into crude. Seasonal tendencies are not reliable on their own; treat them as background.
- Contract rolls. Around expiry, open interest moves between months. ICC uses total futures open interest across contracts to reduce this effect, but roll days still deserve care.
- Headline risk. Positioning can be overwhelmed by supply shocks. Crowded positioning makes those shocks more violent.
A note on natural gas
Natural gas (NG_NATGAS) is even more weather-driven than oil and can move 5% or more in a day. Its COT report
is useful for spotting extremes, but the daily flow and the weather outlook usually matter more for timing. Gasoline
(RB_GASOLINE) and heating oil (HO_HEATOIL) are covered too.
A weekly checklist for oil traders
- Friday after 3:30 PM New York time: check the WTI and Brent speculator net, its weekly change and the COT index.
- Compare WTI with Brent: are funds adding or cutting in both, or only one?
- Note the commercial side. Unusually small producer hedging after a fall can mean prices are near levels producers dislike.
- During the week, follow the daily flow after the US inventory report and OPEC+ news: new buying or long liquidation?
- Decide your plan only after looking at your own chart levels, and keep position size small in fast markets.
Pakistani traders who trade crude on PMEX can use the same data: PMEX crude follows the international price, so the CME positioning behind WTI and Brent is the institutional picture behind their trade.
What else drives oil
Positioning sits alongside the fundamentals every oil trader watches:
- US inventories. The weekly EIA report on crude and product stocks often triggers the biggest daily moves.
- OPEC+ policy. Production targets and compliance change the supply outlook for months.
- Global growth and the dollar. Weaker growth means weaker demand; a stronger dollar makes oil more expensive for most buyers.
- Geopolitics. Supply disruptions can add a risk premium overnight.
The COT report shows how the big money has positioned for all of this. When fundamentals shift against a crowded position, the unwinding of that position is often what turns a normal move into a large one.
Oil positioning and flow in one place
ICC Terminal tracks WTI, Brent, natural gas, gasoline and heating oil with weekly COT and CME daily flow. Pakistani traders can also see which PMEX contracts follow these markets on the Pakistan Markets page.
FAQ
Which oil markets does ICC Terminal cover?
WTI crude oil (CL_OIL), Brent crude oil (BZ_BRENT), natural gas (NG_NATGAS), RBOB gasoline (RB_GASOLINE) and heating oil (HO_HEATOIL).
Are large commercial shorts in oil bearish?
Not by themselves. Producers hedge more when prices are high, so commercial shorts grow in rallies. It is normal hedging, not a forecast.
When is oil COT data released?
With the rest of the CFTC report, every Friday at 3:30 PM US Eastern time, showing positions as of the Tuesday of the same week.