
Currency Strength Meter: Pair the Strongest Currency Against the Weakest
A forex pair is two currencies pulling against each other. If you know which currency is strongest and which is weakest, the best pair to trade often picks itself. Here is how ICC Terminal measures strength — and how to use it.
The idea behind strength meters
EURUSD can rise because the euro is strong, because the dollar is weak, or both. A currency strength meter separates the two: it scores each currency on its own, using all the pairs it trades in. The classic use is simple — buy the strongest currency against the weakest one, where the difference is largest.
Most free meters calculate strength from price changes alone. That tells you what already happened. ICC Terminal goes one step further and builds strength from institutional data: the futures volume behind each move and the positioning of large speculators.
How ICC Terminal builds it
The meter covers eight currencies — USD, EUR, GBP, JPY, CHF, CAD, AUD and NZD — calculated from the seven USD major pairs: EURUSD, GBPUSD, USDJPY, USDCAD, USDCHF, AUDUSD and NZDUSD. Two timeframes are shown side by side in the Currency Strength tab:
| View | Data | Question it answers |
|---|---|---|
| Weekly macro strength | CFTC COT index of each pair | Where is smart money positioned for the coming weeks? |
| Daily institutional strength | CME session moves, weighted by volume | Where did the money flow in the last session? |
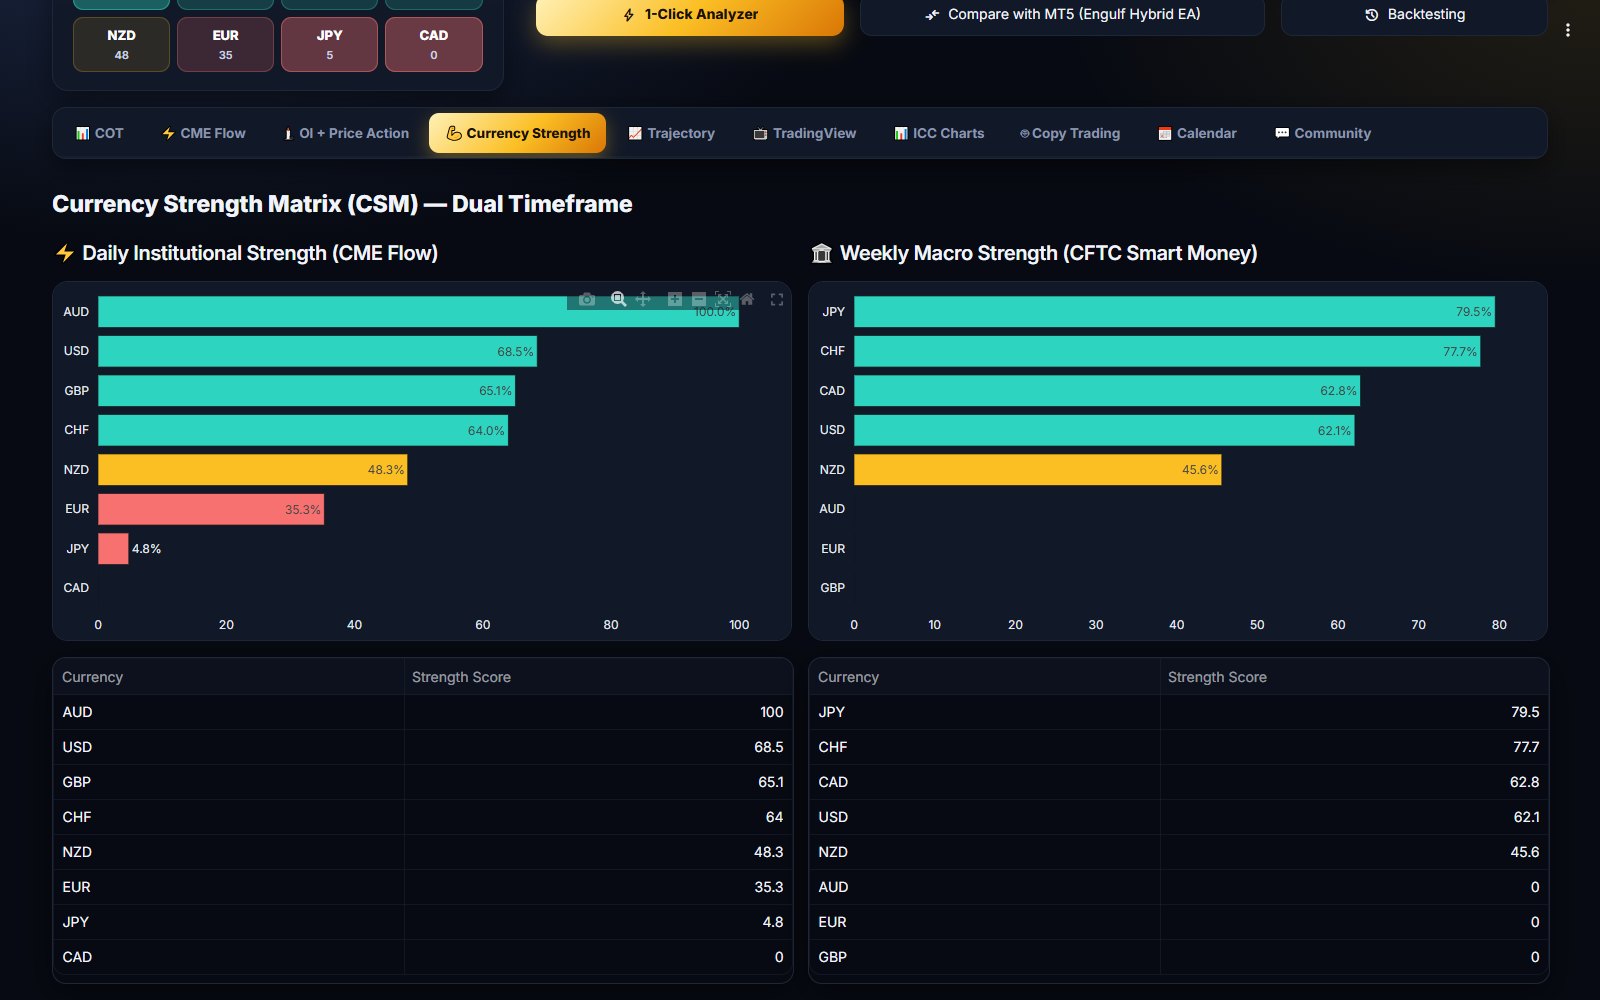
Weekly strength (CFTC)
Each pair has a COT index from 0% to 100% that shows how bullish speculators are on it compared with the last 13 weeks. ICC Terminal turns those pair readings into currency readings:
- EUR, GBP, AUD and NZD take the COT index of their USD pair directly (a bullish EURUSD reading is a strong euro).
- JPY, CAD and CHF are the opposite of their USD pair — a bullish USDJPY reading is a weak yen. The pairs are already read in the pair's own direction, as explained in the forex COT report article.
- USD is the average of the dollar side of all seven pairs.
Daily strength (CME flow)
For the latest CME session, each pair's percentage move is weighted by the square root of its futures volume, so a move on heavy volume counts more than the same move on a quiet day. The base currency of the pair gains the score and the quote currency loses it. The results are scaled from 0% (weakest) to 100% (strongest) for that session.
Choosing pairs
- Find the currency near the top of both views and the one near the bottom of both.
- Form the pair from them — for example strong AUD and weak JPY suggests looking at AUDJPY from the long side.
- If the pair is a cross that ICC does not track directly, check its two USD legs (AUDUSD and USDJPY) in the CME Flow tab for confirmation.
- Avoid pairs of two currencies with similar scores — there is no edge in a tug of war between equals.
A worked example
Suppose the weekly view shows AUD at 82% and JPY at 15%, and the latest session's daily view also has AUD near the top and JPY near the bottom. Speculators have been building AUD longs and yen shorts for weeks, and yesterday's futures volume pushed the same way. That is the kind of alignment traders look for. If instead the daily view had JPY suddenly at the top, the session's flow would be fighting the weekly positioning — a reason to wait for the next session rather than to chase.
Common mistakes
- Reading one session as a trend. Daily strength is rescaled every session; one strong day is not a new trend.
- Ignoring the dollar. Seven of the eight readings involve the USD pairs, so a big dollar move shifts every other currency.
- Trading the strongest currency against the second strongest. The edge is in the gap between top and bottom.
- Forgetting news. Interest-rate decisions and inflation data can turn a weak currency into a strong one in minutes.
Risk-on or risk-off
The Market Pulse gauge on the terminal's overview uses the same daily strength: risk currencies (AUD, NZD, CAD) against safe havens (JPY, CHF, USD). Above 50 means money is flowing into risk; below 50 means it is hiding in safe havens. It is a quick way to see the mood before you look at single pairs.
See currency strength built from real flow
ICC Terminal combines CME volume and CFTC positioning into daily and weekly strength for eight currencies, next to the COT and CME data behind every pair.
FAQ
Which currencies are in the ICC strength meter?
Eight: USD, EUR, GBP, JPY, CHF, CAD, AUD and NZD, calculated from the seven USD major pairs (EURUSD, GBPUSD, USDJPY, USDCAD, USDCHF, AUDUSD and NZDUSD).
Why use futures data instead of price for currency strength?
Price only shows the move. CME volume and CFTC positioning show whether large traders are committing money behind it, which makes the reading less noisy.
What if the daily and weekly strength disagree?
Then the short-term flow is moving against the weekly positioning. Many traders wait, trade smaller, or treat it as an early sign that the weekly picture may change.