
S&P 500 and Nasdaq COT Report: Reading Index Futures Positioning
Stock index CFDs follow CME futures, and the weekly COT report shows how large funds are positioned in them. Here is a plain guide to reading S&P 500 and Nasdaq positioning, and its limits.
Why index futures positioning is worth a look
The S&P 500 and the Nasdaq-100 are the most watched stock indices in the world. Many brokers offer them as CFDs (US500, US100, NAS100 and similar names), and the price you trade follows the CME futures contracts: the E-mini S&P 500 and the Nasdaq-100 E-mini. The weekly CFTC Commitments of Traders report counts how many of these futures each group of large traders holds. ICC Terminal tracks both contracts under the symbols SP500 and NASDAQ.
Who is on each side
ICC Terminal reads the classic legacy futures report, which splits large traders into two groups:
- Non-commercials (large speculators) — hedge funds and trading funds. This is the group most traders call smart money.
- Commercials (hedgers) — in stock indices this mostly means banks, dealers and big asset managers that use the futures to hedge a stock portfolio or to balance client business.
Be careful with one point: in gold or oil, commercials are producers with a clear natural position. In stock indices the "commercial" label is less clean, because large asset managers also hold long futures as part of their investment strategy. So treat the commercial line as context and give more weight to the change in speculator positioning.
How to read the net position
- Net position = speculators' long contracts minus short contracts. Look at the direction over several weeks, not at one report.
- Weekly change — are funds adding to longs, or cutting them while the index still rises? A rising index with a falling net long means the rally has less support behind it.
- Open interest — all open contracts. Rising price and rising open interest means new money is entering; rising price with falling open interest often means shorts are simply closing.
The COT index puts the current net position inside its recent range. In ICC Terminal the weekly index uses the last 13 reports: 70% or more is shown as STRONG BUY, 30% or less as STRONG SELL, and the monthly view gives the 12-month picture.
S&P 500 versus Nasdaq: compare them
The S&P 500 covers a broad group of large US companies. The Nasdaq-100 is more concentrated in technology and growth names, so it usually reacts faster to changes in risk appetite. Reading both together tells you more than reading one:
- Both net longs rising — funds are comfortable taking risk across the board.
- Nasdaq net long rising, S&P flat — money is rotating into growth and technology.
- Both falling while prices are high — funds are quietly reducing risk. This is a warning, not a sell signal.
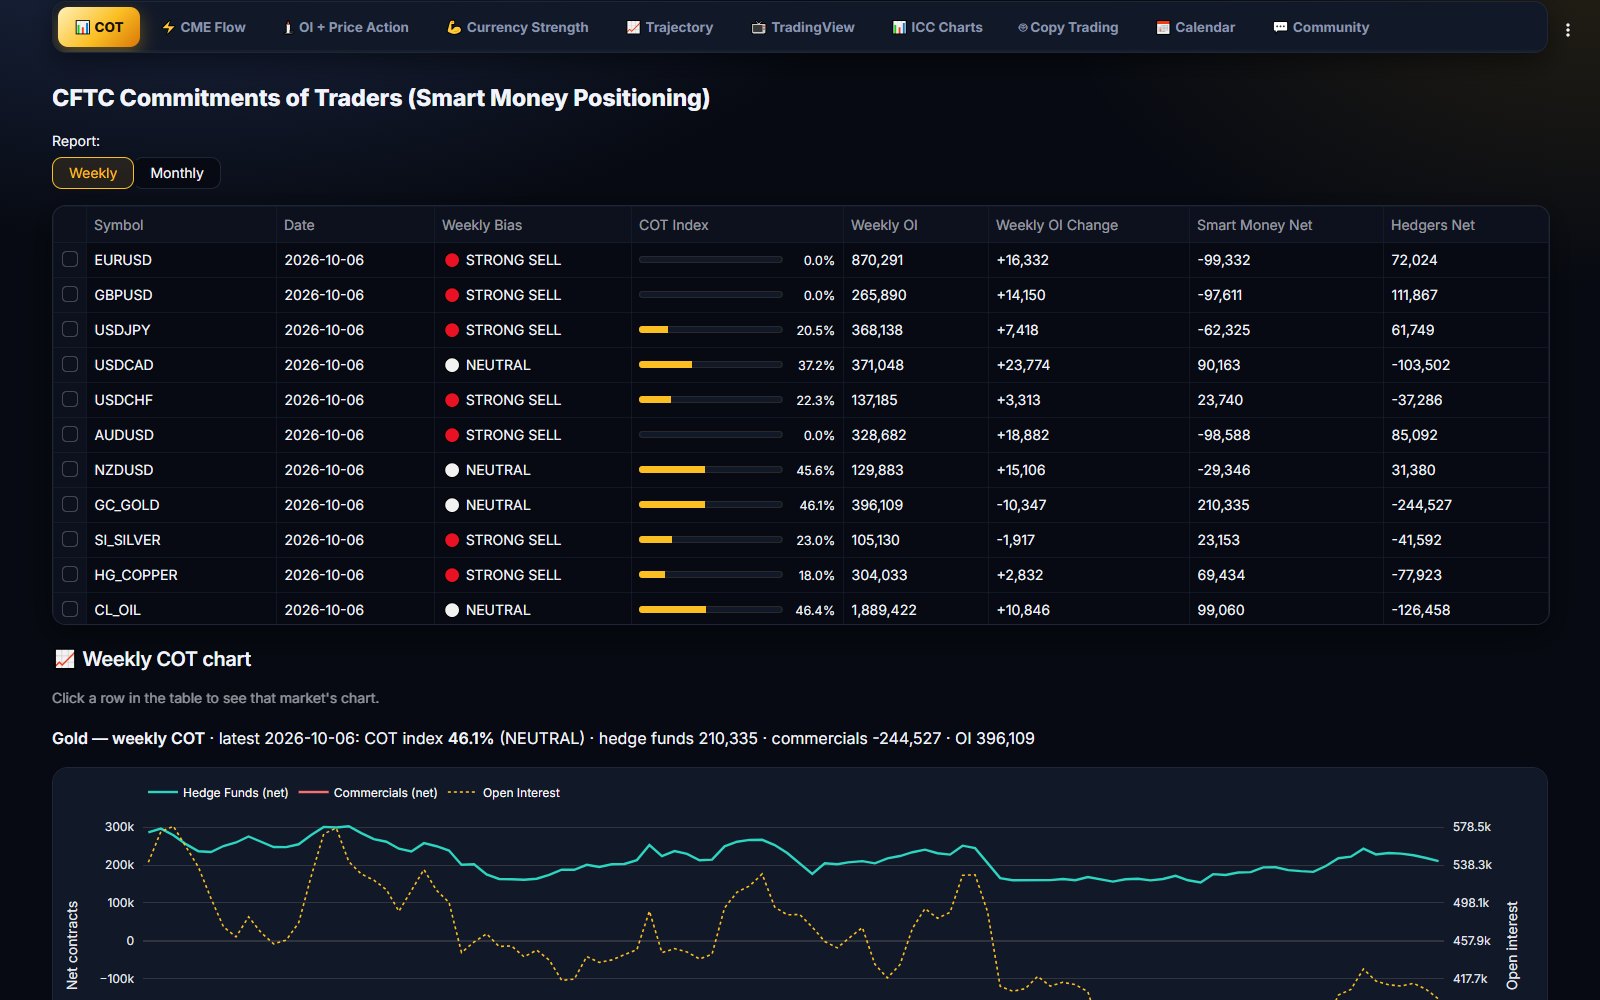
The ICC Terminal COT tab lists many markets in one table, so you can sort them and compare indices, the dollar and gold in a minute. Our forex COT guide shows the same method for currencies.
Quarterly expiry and rollover
Stock index futures expire four times a year, in March, June, September and December. In the days before expiry, traders roll from the old contract to the next one, and open interest and volume can look strange for a few sessions. Do not read a roll as a sudden exit of money. Check the CME daily volume and open interest data for a few days before drawing a conclusion; ICC Terminal shows the next expiry date for each market.
A simple weekly routine
- After the Friday release, open the COT tab and select SP500 and NASDAQ.
- Note the COT index and the weekly change for both.
- During the week, use the open interest + price action view to see whether daily moves are backed by new positions.
- Trade only with your own levels and a stop-loss, and skip weeks where the weekly and daily pictures disagree.
Index positioning in one table
Open the COT tab in ICC Terminal to see SP500, NASDAQ, Dow, Russell 2000 and more, with the COT index and weekly change.
FAQ
Which contracts does ICC Terminal use for the S&P 500 and Nasdaq?
The E-mini S&P 500 (CFTC code 13874A) as SP500 and the Nasdaq-100 E-mini (code 209742) as NASDAQ, both traded on CME.
Can I use this for US500 or NAS100 CFDs?
Yes. Index CFDs follow the same index as the futures, so the positioning of futures traders is useful context for them.
How often is the data updated?
The CFTC publishes the COT report every Friday with positions as of the previous Tuesday. CME volume and open interest are daily.