
COT Report Mistakes: 7 Common Errors and How to Avoid Them
The COT report is free and powerful, but it is easy to misuse. These are the seven mistakes traders make most often, and a short checklist that keeps your reading honest.
Sign in with Google in the app or the web terminal. No card needed.
QR code, size and install stepsWhy COT mistakes are so common
The weekly Commitments of Traders report is free, simple to download and full of big numbers. That makes it easy to misuse. Most beginners open the table, see that "speculators are net short", and decide to sell or buy. The report was not built for that. It is a record of who holds what, published with a delay. If you are new to it, start with how to read the COT report; this article lists the seven errors that cost traders the most.
1. Treating Tuesday data as live data
The CFTC takes its snapshot on Tuesday and publishes it on Friday. By the time you read it, the market has had three more trading days. News, central bank speeches or a large move can already have changed positions. Read the report as the background of the week, not as a signal for the next hour. The full timeline is in release time and the Tuesday-to-Friday lag.
2. Reading one week instead of the trend
A single net position says little. What matters is the direction of the last four to eight weeks: is the net short growing, shrinking or flipping? A position that rises for six weeks and then stalls is more interesting than the same level on its own.
3. Ignoring open interest
Net position and open interest answer different questions. Net position says who is on which side. Open interest says whether money is entering or leaving. If speculators add to a long while open interest rises, new buyers are arriving. If the net long grows only because shorts are closing, that is a different story. Read both together: see open interest and price action.
4. Using raw numbers instead of the COT index
"Managed money is net long 120,000 contracts" means nothing without history. Each market has its own scale, and even the same market changes over the years. The COT index places the current net position on a 0–100% scale against its own past, so extremes become visible. You can test any value with the COT index calculator.
5. Mixing up the trader groups
The legacy report has commercials and non-commercials. The disaggregated report splits them into producers, swap dealers, managed money and others. A "speculator" in one report is not the same set of traders in the other. Commercials are also not always "right"; they hedge real business and do not trade for a view. Learn the difference in managed money vs commercials and smart money vs hedgers.
6. Treating an extreme as an instant reversal signal
An extreme reading can stay extreme for months in a strong trend. A crowded long can become more crowded. Positioning tells you where the market is fragile, not when it will break. Wait for price to confirm, for example with a change in structure, before you act on an extreme.
7. Skipping risk management
Even a good read can fail, because the report is delayed and the market can ignore it. Size every trade from the stop and the amount you accept to lose. The lot size calculator and the risk-reward calculator take a minute and prevent most large losses.
A short checklist before you use any COT reading
- Which date is the data from, and what has happened since?
- Which report and which group am I reading?
- What is the COT index, and how did the net position change over several weeks?
- Is open interest rising or falling?
- Does price agree, and where would I be wrong?
Build a habit, not a system
The best way to avoid these errors is a fixed routine. Read the report on the same day each week, write down the net position, the COT index and the open interest change, and add one line about what you think it means. After a few months you will have a small journal that shows when the report helped and when it did not. That honest record teaches more than any rule, and it keeps you from fitting the story to the numbers after the fact. If a reading does not fit your view of the market, accept that and skip the trade instead of searching for a reason to take it. Missing a trade costs nothing, while a forced trade can cost a lot.
How to use it with ICC Terminal
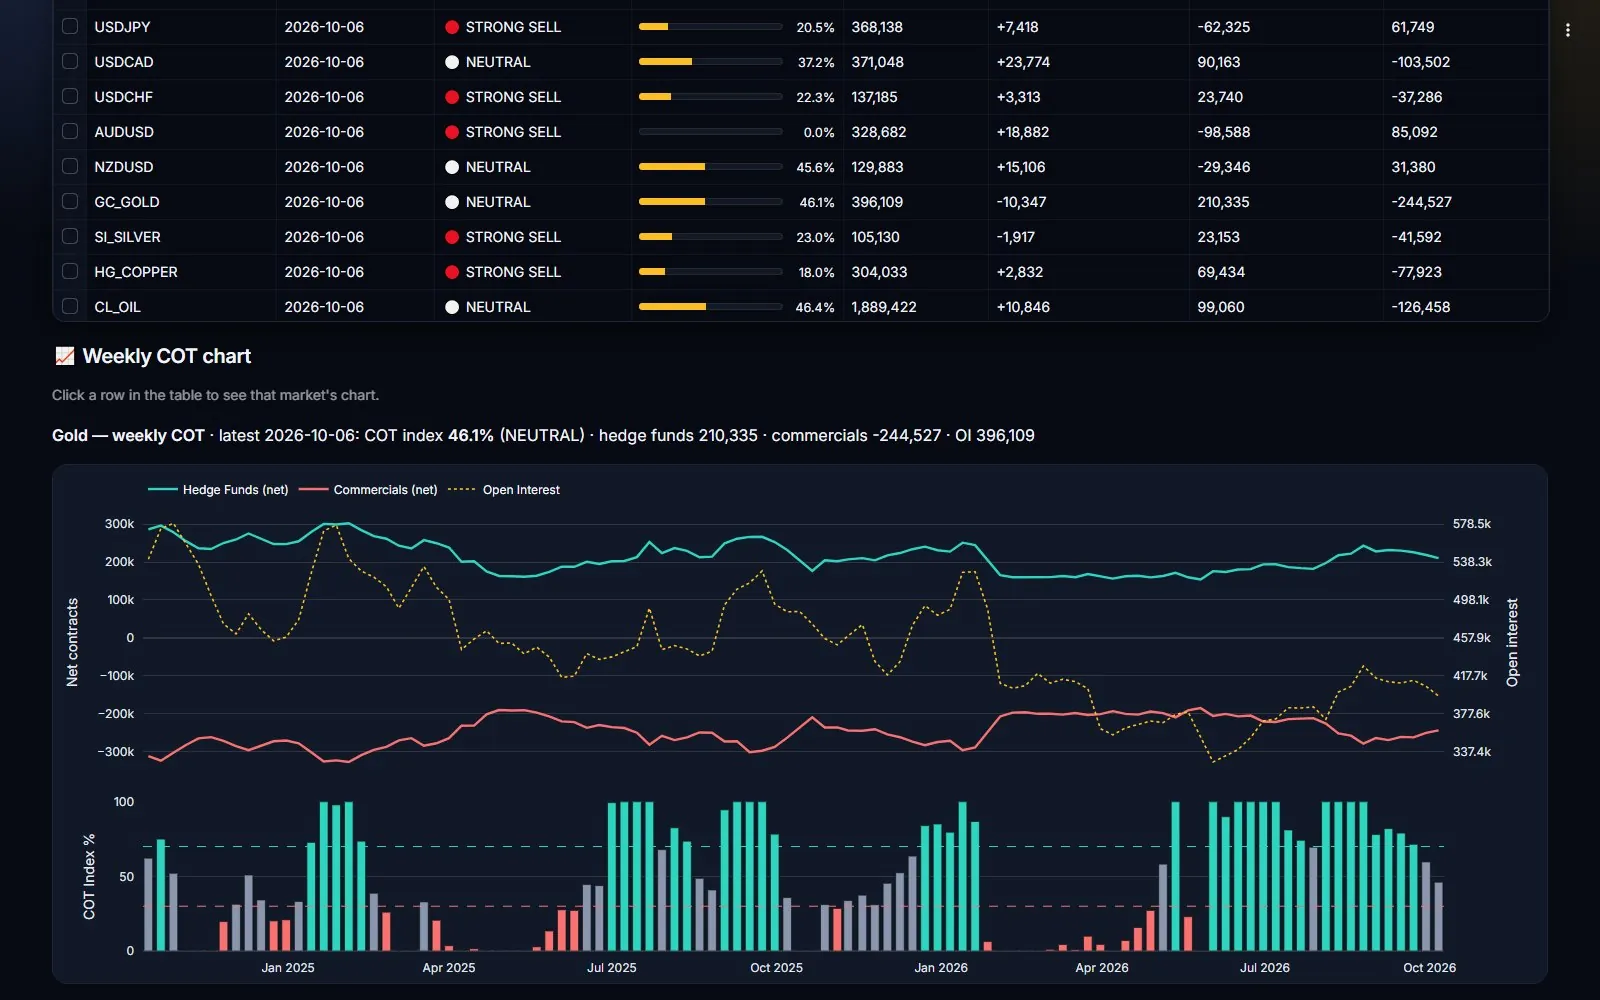
The ICC Terminal COT tab shows net positions, the COT index and the weekly trend for each market, so you do not have to calculate them by hand. The latest figures are always on the COT report this week page, and the COT guide explains each screen. If you want to learn the terms first, the COT glossary and the free COT course are good places to start.
The5%ers Partner link We may earn a commission if you buy through it. Prop firm challenges are paid evaluations; most traders don't pass. Trade only what you can afford to lose.
Avoid the common errors
ICC Terminal shows the COT index, the trend of the net position and open interest in one tab.
Get these numbers every day in the app – 14 days of VIP free
Get the COT report every Saturday on Telegram → t.me/icccharts
CFDs and futures carry a high risk of losing money. We may earn a commission if you open an account through this link.
FAQ
What is the most common COT report mistake?
Treating the report as a live trading signal. The data is from Tuesday and published on Friday, so it describes the past and should be used as context.
Can I trade using only the COT report?
It is better not to. The report is delayed and shows holdings, not intentions. Combine it with price, open interest and clear risk rules.
Does an extreme COT index always mean a reversal?
No. Extremes can last for a long time in a strong trend. They show that positioning is stretched, not when it will change.