
Open Interest: Long Buildup vs Short Covering in Gold and Crude
A rising market can come from new buyers or from short sellers leaving, and open interest is how you tell them apart. This guide explains long buildup, short buildup, short covering and long unwinding with simple gold and crude oil logic.
Why this matters
Price tells you what happened. Open interest tells you whether new positions are being opened or old ones closed. Together they answer a simple question: is this move supported by fresh money, or is it only people leaving? Traders use four common labels for this. Two of them, long buildup and short covering, are often confused, and the mix-up leads to wrong bias calls.
A quick reminder: what open interest is
Open interest is the number of futures contracts that are still open at the end of a day. A contract needs a buyer and a seller. When a new buyer and a new seller trade, open interest goes up by one. When two traders close existing positions against each other, it goes down by one. If a new trader buys from someone who is closing, open interest does not change. Volume is different: it counts every trade, whether it opens or closes. The full basics are in open interest and price action.
The four combinations
- Long buildup: price up, open interest up. New buyers are entering and sellers are taking the other side. The rise has fresh participation behind it.
- Short buildup: price down, open interest up. New sellers are entering. The fall has fresh participation.
- Short covering: price up, open interest down. Existing short sellers are buying back to close. The rise is driven by exits, not by new bulls.
- Long unwinding: price down, open interest down. Existing buyers are selling to close. The fall is driven by exits, not by new bears.
Buildup is generally read as a move with conviction; covering and unwinding are read as weaker, because they can fade once the exits are done. This is a tendency, not a rule.
Example logic with gold
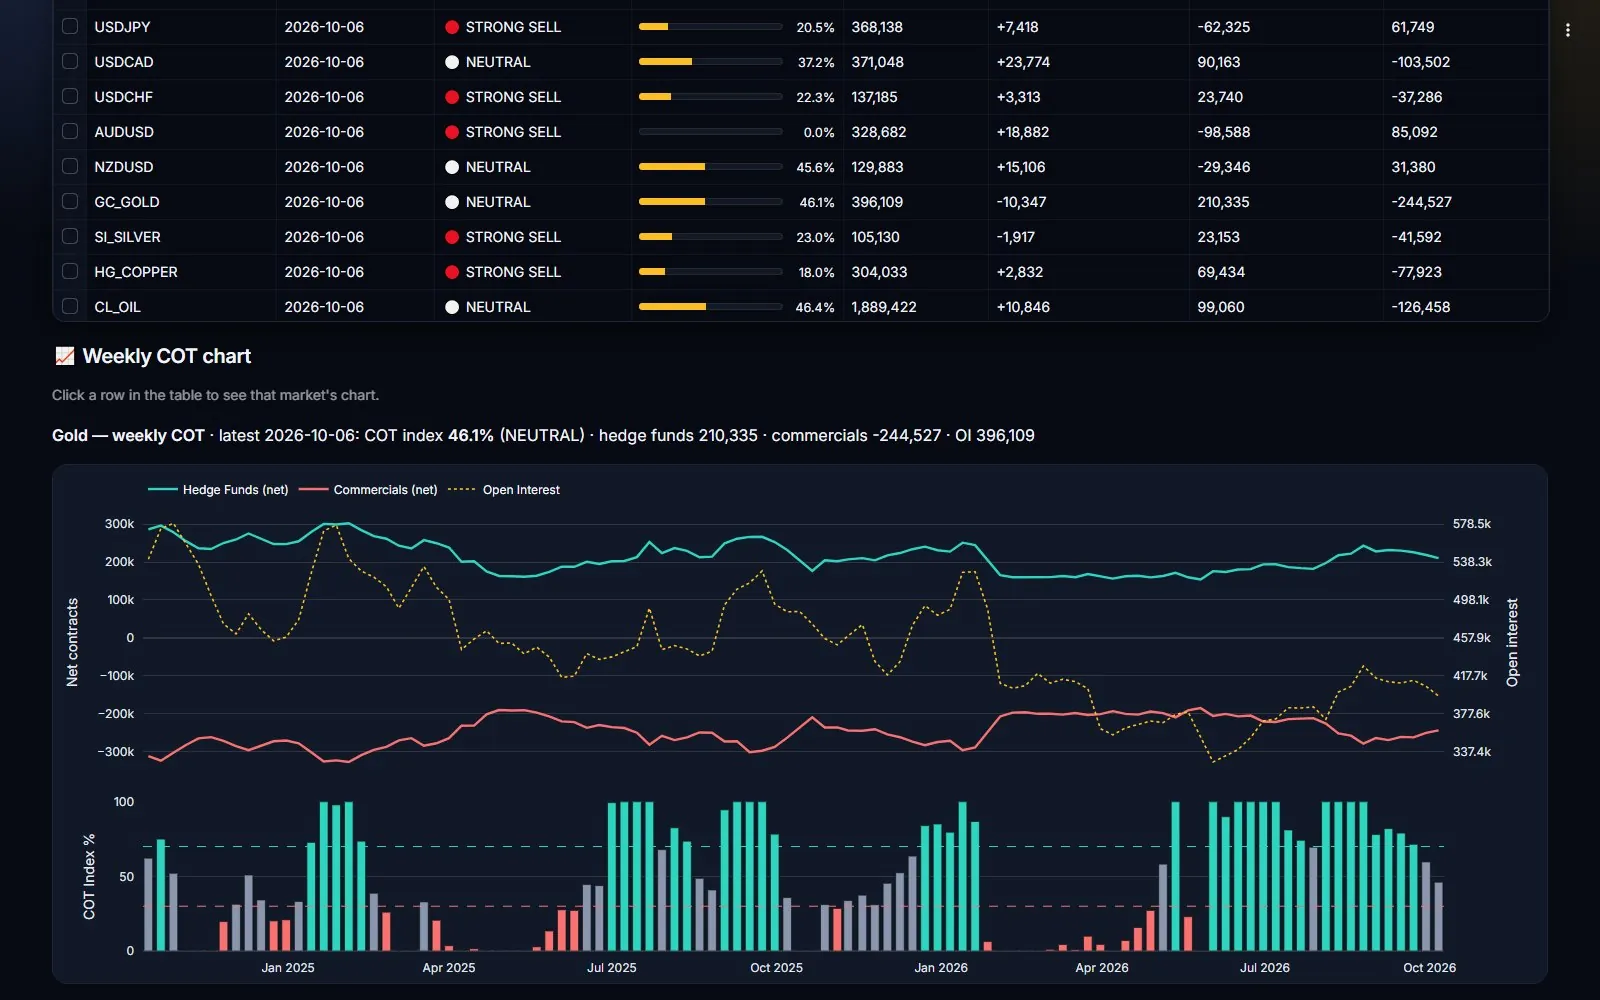
Imagine gold futures rise through a day. If open interest on the CME daily report also rises, you have a long buildup: new longs are joining. If open interest falls while price rises, that points to short covering: the same rally is mostly shorts leaving. Both rallies look the same on the chart, but their quality differs. For the bigger weekly picture, compare it with the gold COT report to see who holds the positions: funds or hedgers.
Example logic with crude oil
Crude oil often shows sharp short covering after a long decline, because many speculators hold the same short view. If price jumps and open interest drops, treat the move with care: it may stop once the shorts are out. If price keeps rising and open interest also climbs over several days, buyers are accumulating. The crude oil COT guide explains how the weekly groups behave in energy markets.
How to use it step by step
- Pick one market and one time frame. Daily changes are noisy; compare at least three to five sessions.
- Write down the change in price and in open interest for each session. Label it with one of the four names.
- Check contract rolls. Near expiry, open interest can fall only because traders move to the next contract. Do not read this as unwinding.
- Add the weekly view. Check who holds the positions in the COT report and whether the COT index is near an extreme.
- Plan the trade separately. Use your own chart for entry and stop, and size with the lot size calculator.
Common mistakes
- Treating open interest as direction. It shows participation, not whether the new money is long or short; the price move supplies that.
- Mixing up volume and open interest. High volume with flat open interest means mostly day trading.
- Ignoring the data lag. Daily CME data arrives after the session, and weekly COT data is from Tuesday (see release time and data lag).
- Using it on its own. It is a filter that supports your analysis, not a trigger.
Where to find it in ICC Terminal
ICC Terminal shows CME daily volume and open interest and a 5-day bias view, so you can see the labels develop over several sessions rather than one. India readers can use the same idea on index futures in Nifty and Bank Nifty open interest. The guide explains each screen.
Daily CME flow in one tab
ICC Terminal shows CME volume, open interest and a 5-day bias so you can see buildup and covering develop.
Get the COT report every Saturday on Telegram → t.me/icccharts
CFDs and futures carry a high risk of losing money. We may earn a commission if you open an account through this link.
FAQ
What is the difference between long buildup and short covering?
Both show rising prices. In a long buildup open interest rises, meaning new buyers are entering. In short covering open interest falls, meaning existing short sellers are closing positions.
Does falling open interest mean a trend is over?
Not always. It means positions are being closed. Near contract expiry it can also be caused by traders rolling into the next contract.
Is open interest the same as volume?
No. Volume counts every trade in a session, while open interest counts the contracts that remain open at the end of the day.