
Natural Gas COT Report: Reading Positioning Through the Seasons
Natural gas moves with weather, storage and the seasons, so its COT report needs a different reading than gold or crude oil. This guide shows who the traders are, how to read the net position through the year, and what to avoid.
Sign in with Google in the app or the web terminal. No card needed.
QR code, size and install stepsWhy natural gas positioning is different
Natural gas is one of the most volatile markets on the CME. Unlike gold, it is not a store of value, and unlike crude oil it is hard to move across oceans, so its price depends heavily on local weather, storage and seasons. Because of this, a net position in natural gas can change character quickly, and a reading that looks extreme in autumn may look normal in January. The weekly COT report is still useful, but only if you read it with the calendar in mind.
What the COT report measures for natural gas
The main contract is the NYMEX Henry Hub natural gas future. The CFTC publishes positions for it every week, grouped by trader type. In the legacy report you see non-commercials (speculators) and commercials (producers, utilities, merchants). In the disaggregated report the speculators are split further, and managed money is the group most traders watch. The differences are explained in managed money vs commercials.
- Producers sell future gas to lock in a price, so commercials are often net short as a group.
- Utilities and heavy users buy to protect against a cold winter or a hot summer.
- Managed money follows trends and weather forecasts, and often changes direction fast.
The general logic of who is who is covered in smart money vs hedgers. Remember that commercials are not "smart" because they are always right; they simply hedge real business and do not trade for a view.
Seasons, storage and weather
Gas demand has two peaks: winter heating and summer power use for cooling. Supply and demand are balanced by gas held in underground storage, and a weekly storage report shows how much was added or removed. Traders react to the surprise against expectations, and speculators often add or cut positions around it. When you open the COT data, ask these questions:
- Which season is the market in, and which season is it already looking ahead to?
- Is storage above or below its usual level for this time of year?
- Did the position change before or after a big weather forecast change?
Because of this, compare the current reading with the same time in past years as well as with the last few weeks.
How to read it step by step
- Look at the net position of managed money and the direction of the last four to six weeks. Growth in a net short that stops growing can matter more than the level itself.
- Compare with commercials. When both groups are heavily on opposite sides, the market is stretched, and sharp reversals become more likely.
- Use the COT index. The COT index places today's net position on a 0–100% scale against its own history. Gas is seasonal, so use a long enough window. You can test values with the COT index calculator.
- Check open interest. Rising open interest in a trend suggests new money; falling open interest suggests positions are closing. See open interest and price action.
How it compares with crude oil
Many beginners treat gas like oil. They are linked weakly at best. Oil is a global market with OPEC and shipping; US gas is mostly a regional market driven by weather and pipelines. The crude oil COT guide covers WTI and Brent, and it mentions gas briefly. A fund can be bullish on oil and bearish on gas at the same time without any contradiction.
Common mistakes
- Reading a net short as "price must fall". Extreme shorts can also fuel violent short covering when the weather turns.
- Ignoring the lag. The data is from Tuesday and published Friday, so a weather shock on Wednesday is not in it (see release time and data lag).
- Trading with too much size. Gas can move several percent in a day, so check your risk with the risk-reward calculator and the lot size calculator before you enter.
- Using one report. A single week is a snapshot; the trend of weeks is the information.
How to use it with ICC Terminal
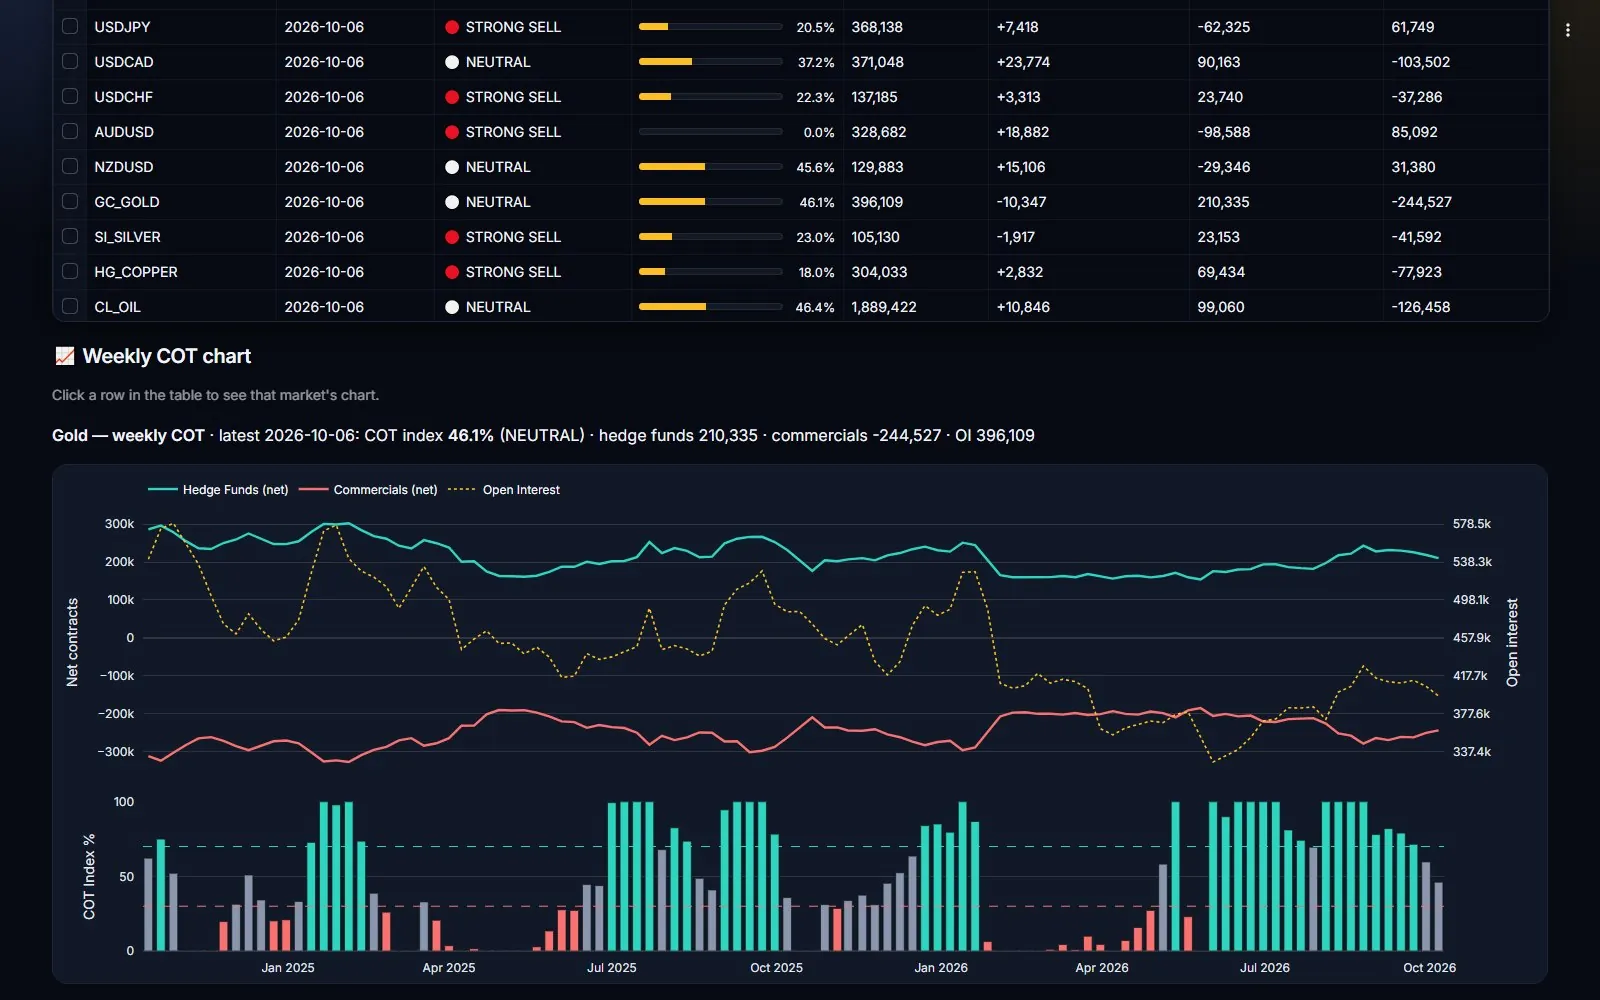
Natural gas is included in the energy markets of the ICC Terminal COT tab, next to WTI and Brent. A practical routine: check the COT tab on Friday, note the managed money trend and the COT index, then look at the daily volume and open interest from the CME daily report to see if the market is still moving the same way. The COT guide explains each screen, and the latest figures are on the COT report this week page.
The5%ers Partner link We may earn a commission if you buy through it. Prop firm challenges are paid evaluations; most traders don't pass. Trade only what you can afford to lose.
Energy positioning in one tab
ICC Terminal's COT tab covers natural gas, WTI and Brent with COT index signals.
Get these numbers every day in the app – 14 days of VIP free
Get the COT report every Saturday on Telegram → t.me/icccharts
CFDs and futures carry a high risk of losing money. We may earn a commission if you open an account through this link.
FAQ
Is natural gas included in the COT report?
Yes. The CFTC publishes weekly positions for the NYMEX Henry Hub natural gas future, in both the legacy and disaggregated reports.
Does a large managed money net short mean gas will fall?
Not by itself. It shows funds expect lower prices, but a crowded short can reverse sharply if weather or storage surprises. Use it as context, not as a signal.
Why is the COT index for gas hard to use?
Natural gas is seasonal, so a position that is extreme in one season may be normal in another. Use a long history and compare similar times of the year.