
US Treasury Bonds COT Report: Reading 2Y, 5Y, 10Y and 30Y Positioning
Treasury futures show how big traders position for interest rates, which move gold, the dollar and stocks. This guide explains the contracts and how to read their weekly COT data without confusion.
Why bond futures matter
Interest rates touch almost everything: loans, the dollar, gold, and the value of company shares. The US Treasury market sets the base level for rates worldwide, so many traders follow it even if they never trade a bond. The CME lists futures on Treasury securities of different lengths, and they are part of the weekly Commitments of Traders report.
ICC Terminal tracks four of them in the COT tab:
- ZT_2Y: the 2-year note, closest to expected Fed decisions.
- ZF_5Y: the 5-year note, a middle point.
- ZN_10Y: the 10-year note, the most watched benchmark.
- ZB_30Y: the 30-year bond, sensitive to long-term inflation and debt worries.
Price and yield move opposite
This is the first thing to learn. A bond future's price goes down when yields go up. So a speculator who is net long Treasury futures is betting that yields will fall, and a net short speculator expects yields to rise. If you read a chart of the future, a rising line means falling yields.
Who is on each side
- Non-commercials: funds and trading firms taking a view on rates.
- Commercials: dealers and institutions that hedge bond holdings.
- Small traders: a minor group in this market.
Treasury positions can look strange because many large funds use futures to hedge or to run basis trades against cash bonds. Large net numbers do not always mean a simple directional bet. That is why you should watch the change over weeks rather than a single level. The article on smart money vs hedgers covers this idea in more detail.
How to read it step by step
- Pick one contract. Start with ZN_10Y, then compare the 2Y and 30Y to see if the whole curve agrees.
- Check the trend of the net position. Several weeks of rising or falling is more meaningful than one reading.
- Use the COT index. The COT index places the net position in its range. In ICC Terminal, 70% or more on the 13-week view reads STRONG BUY and 30% or less STRONG SELL, where BUY means long the future, not long yields.
- Add open interest. Rising open interest with a trending price means new positions are being opened; see open interest and price action.
Linking bonds to gold, the dollar and stocks
- Gold: falling yields usually help gold, which pays no interest. Compare with the gold COT.
- Dollar: higher US yields often support the dollar; check the currency strength meter and the euro COT.
- Stocks: quick rises in yields can pressure growth shares. See the S&P 500 and Nasdaq COT.
These links are tendencies, not rules, and they change from one period to the next.
What to expect from the data
Bond positioning moves slowly compared with metals or currencies, and the 2Y contract often reacts to central bank news while the 30Y reacts to longer worries about inflation and government debt. When the 2Y and the 30Y show different trends, the market is expressing a view on the shape of the yield curve, not only its direction.
For a beginner, the best use of this data is as a calm background check. Ask one question each week: are large speculators adding to their rate view or reducing it? If they are reducing, the old trend may be tiring. If they keep adding, the trend still has funding, but the trade is also getting more crowded. Neither answer gives an entry on its own.
How to use it with other ICC tools
Treat the bond COT as background for rates, then use the daily CME volume and open interest to see current activity. The COT guide and the free COT course explain each screen, and the glossary defines terms such as net position and basis.
When you size a trade on gold or forex because of a rate view, use the free lot size calculator on ICC Charts.
Rates positioning in one place
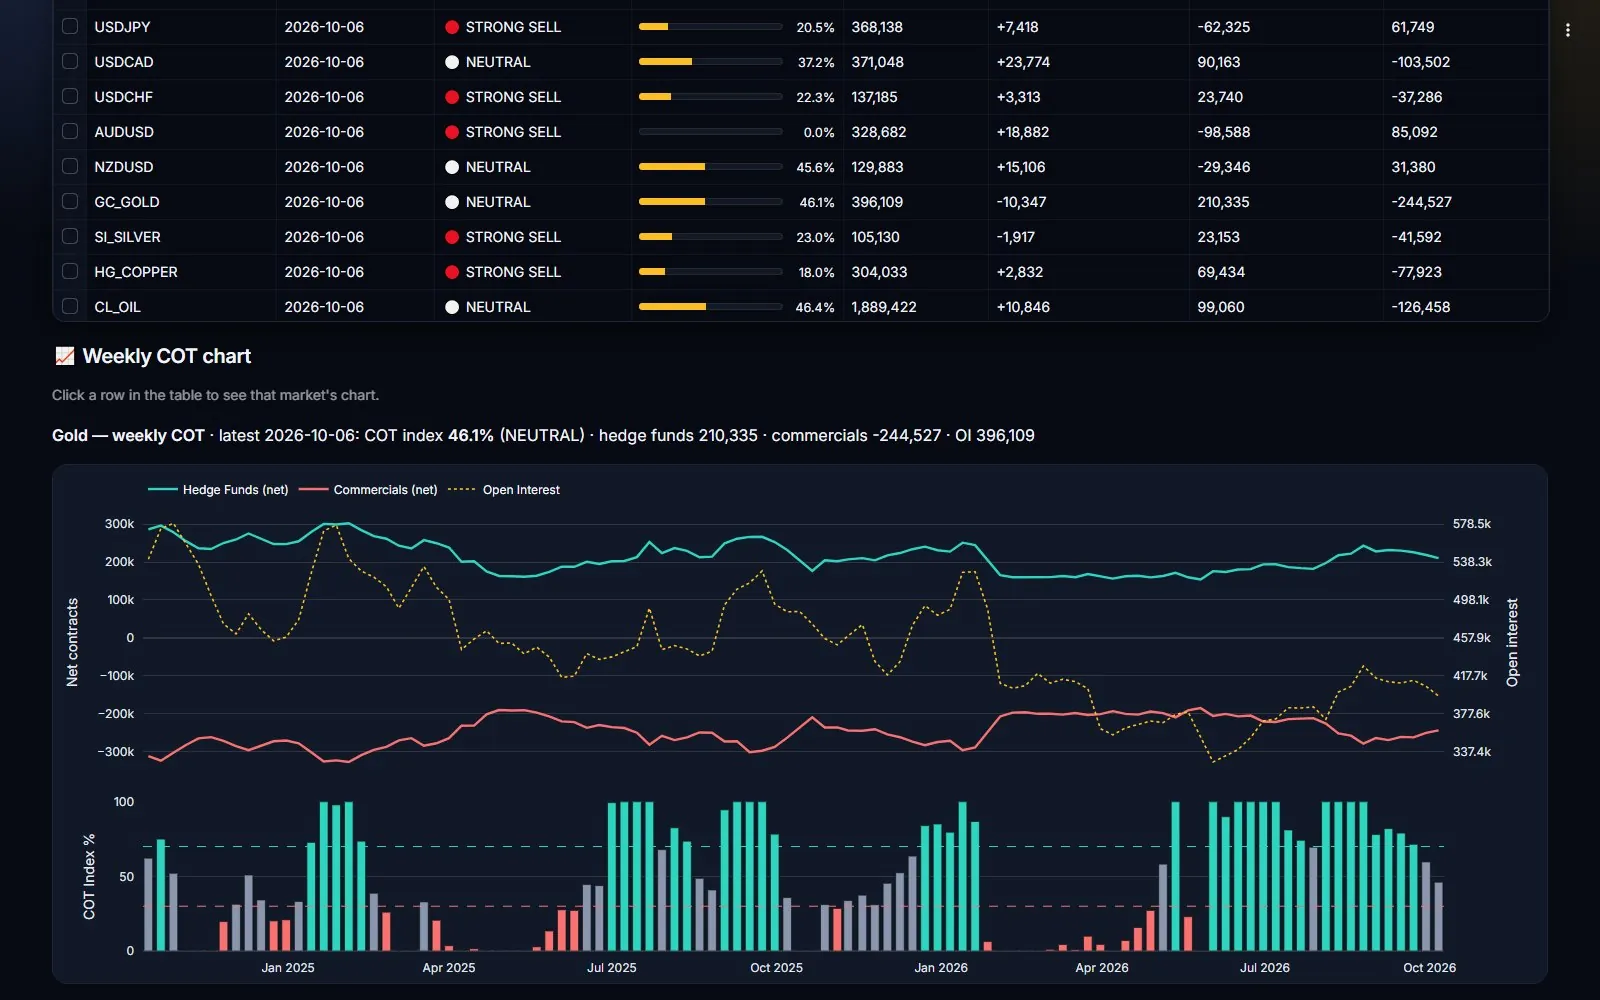
The COT tab in ICC Terminal includes the 2Y, 5Y, 10Y and 30Y Treasury contracts, plus metals, oil, indices and currencies.
FAQ
Do Treasury futures prices move with yields?
They move in the opposite direction. When yields rise, bond and note futures prices fall, and the other way round.
Which Treasury markets does ICC Terminal track?
The 2-year, 5-year, 10-year and 30-year contracts, shown as ZT_2Y, ZF_5Y, ZN_10Y and ZB_30Y.
Is a big speculator long position bullish for stocks?
Not by itself. The report shows positions in one market and does not predict what another market will do.