
Swiss Franc and New Zealand Dollar COT Report: Reading CHF and NZDUSD Positioning
The Swiss franc and the New Zealand dollar sit at opposite ends of the risk spectrum: one is a classic safe haven, the other a risk-sensitive commodity currency. Here is how to read the CFTC positioning for both, and where the data can mislead you.
Sign in with Google in the app or the web terminal. No card needed.
QR code, size and install stepsWhat the CFTC reports for CHF and NZD
The CFTC Commitments of Traders report covers currency futures traded on the CME. For the Swiss franc and the New Zealand dollar these are the 6S and 6N contracts. Each one is quoted as US dollars per unit of the foreign currency, so it moves opposite to the USDCHF pair and with NZDUSD. That one detail trips up many readers: a rising Swiss franc future means a falling USDCHF chart.
The report lists long and short positions for each trader group. If the idea is new to you, read how to read the COT report first, then come back. For currencies the group that gets the most attention is leveraged funds in the financial-futures report, which is the closest match to speculative money. You can compare it with managed money vs commercials to see why the labels differ between reports.
Swiss franc: a safe haven with a central bank
The franc tends to attract money when markets feel nervous, which is why traders call it a safe haven. Three things shape its positioning:
- Risk mood. Stress in equities or geopolitics can push funds toward the franc.
- The Swiss National Bank. The central bank has a history of leaning against a very strong franc, so a stretched long position can run into policy risk.
- Interest rate gaps. Switzerland usually has lower rates than the US, so holding the franc often means giving up carry.
Because of this, the CHF net position can stay long or short for long periods and then change quickly after a shock. Look at the direction of change over several weeks, not at a single report. The Swiss franc COT page is rebuilt from the CFTC data every Friday, so you can see the current picture without calculating anything.
New Zealand dollar: a small, risk-sensitive market
The kiwi is linked to dairy exports, to demand from China and to global risk appetite. It is also a much smaller market than the euro or yen. That has two consequences for the COT report:
- Open interest is lower. A few large funds can move the net position a lot, so the series is noisier.
- Policy matters. Reserve Bank of New Zealand decisions and rate expectations can change the story between two Tuesdays.
When the kiwi net position is stretched and open interest is falling, that is often a sign of a crowded trade losing energy; when open interest rises with the position, new money is joining. Our open interest and price action article explains this pairing in detail, and the NZD COT page shows the latest data.
Use the COT index to compare across time
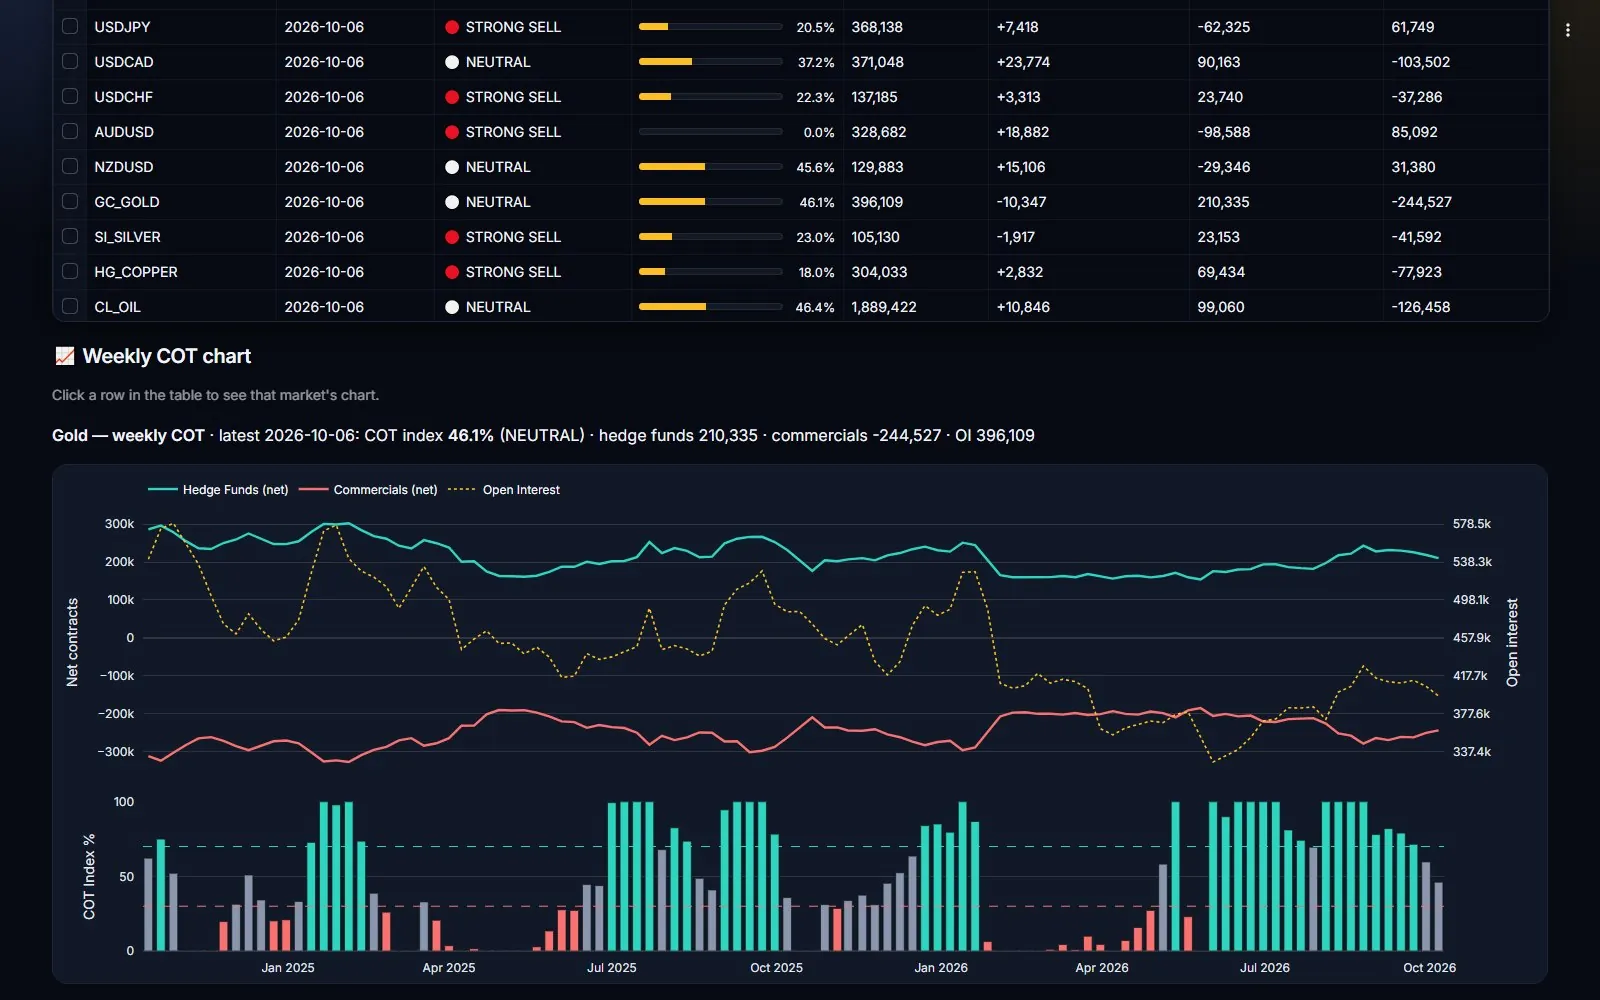
Raw net numbers are hard to compare, because the franc and the kiwi have different market sizes. The COT index rescales the net position to a 0-100% range over a chosen look-back window, so you can see whether positioning is near its own extremes. The method is covered in the COT index explained, and you can try your own figures in the COT index calculator.
A reading near either end says that positioning is crowded. It does not say the price will turn. Strong trends can keep an index near an extreme for months, so use it as a warning to look at price, not as an entry signal.
A simple weekly routine for CHF and NZD
- Check the report date. The data is from Tuesday and published on Friday; see the release time and data lag.
- Note the net position of leveraged funds and its change over four to six weeks.
- Check open interest: rising with the position means new commitment, falling means closing.
- Compare with the currency strength meter. If funds are long the franc and the meter also shows the franc strong, the picture agrees. If they disagree, wait.
- Decide where you would be wrong before you think about a trade.
The same routine, with the full forex set, is in our weekly COT and currency strength workflow, and the forex COT report guide covers the major pairs together.
Mistakes to avoid
- Mixing up the direction. The future is USD per CHF, so a long franc future is a short USDCHF view.
- Treating the safe-haven label as a rule. The franc does not always rise when stocks fall.
- Ignoring thin markets. Small open interest in NZD means one week can look dramatic and mean little.
- Using the report as a timing tool. It is delayed. See seven common COT mistakes for more.
How to use it with ICC Terminal
The ICC Terminal COT tab shows net positions, the COT index and the weekly trend for every covered market. The Friday data pages for CHF and NZD are a quick way to check the latest numbers, and the COT guide explains each screen.
The5%ers Partner link We may earn a commission if you buy through it. Prop firm challenges are paid evaluations; most traders don't pass. Trade only what you can afford to lose.
See CHF and NZD positioning
Open the COT tab to see net positions, the COT index and the trend for the franc, the kiwi and other currencies.
Get these numbers every day in the app – 14 days of VIP free
Get the COT report every Saturday on Telegram → t.me/icccharts
CFDs and futures carry a high risk of losing money. We may earn a commission if you open an account through this link.
FAQ
Is the Swiss franc COT report the same as USDCHF positioning?
Not exactly. The CME contract is quoted in dollars per franc, so a long franc position matches a short USDCHF view. Always check the direction before you compare.
Why is the NZD COT data noisy?
The New Zealand dollar futures market is small, so a few large funds can change net positions a lot from one week to the next. Look at several weeks and at open interest.
Which trader group should I watch for currencies?
Most traders follow leveraged funds in the financial-futures report, because it is the closest match to speculative money. Treat it as context, not a signal.